
The CYFIRMA Industry Report delivers original cybersecurity insights and telemetry-driven statistics of global industries, covering one sector each week for a quarter. This report focuses on the energy & utilities organizations, presenting key trends and statistics in an engaging infographic format.
Welcome to the CYFIRMA infographic industry report, where we delve into the external threat landscape of the energy & utilities industry over the past three months. This report provides valuable insights and data-driven statistics, delivering a concise analysis of attack campaigns, phishing telemetry, and ransomware incidents targeting the energy & utilities organizations.
We aim to present an industry-specific overview in a convenient, engaging, and informative format. Leveraging our cutting-edge platform telemetry and the expertise of our analysts, we bring you actionable intelligence to stay ahead in the cybersecurity landscape.
CYFIRMA delivers pre-emptive cybersecurity, cyber threat intelligence, and external threat landscape management through its platforms, DeCYFIR and DeTCT. These platforms have been purpose-built over many years to continuously collect, correlate, and analyse large volumes of external threat data, combining proprietary intelligence automation with deep, hands-on cyber threat research.
For the purposes of this report, the analysis draws on intelligence generated from CYFIRMA’s platforms. The data referenced has been processed through automated correlation and enrichment mechanisms, informed and validated by human-led research and investigative expertise, and sourced from both structured and unstructured external intelligence channels.
While this report contains data collected and processed by our in-house AI and ML, all charts, statistics, and analyses are done by human CYFIRMA CTI analysts to ensure the highest quality and provide accurate insights.
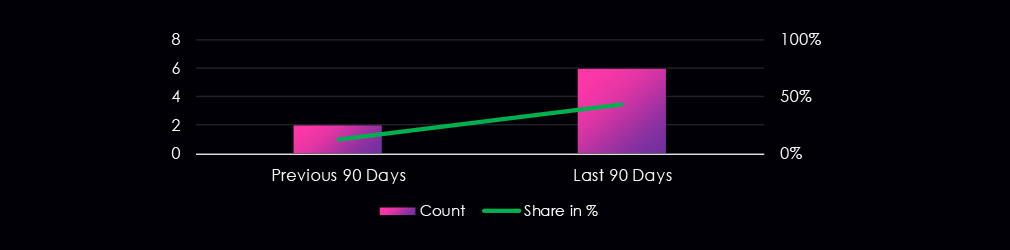
The energy & utilities industry featured in 6 out of the 14 observed campaigns, which is a presence in 43% of all campaigns, an increase from the previous period, where energy & utilities organizations were present in just 2 out of 15 campaigns (13% presence).

The monthly trends show a major uptick of detections during January, with December recording 1 campaign and a few days of February already showing another detection.
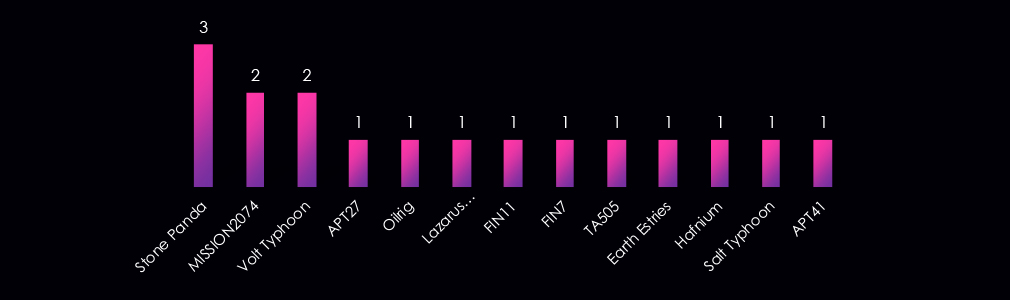
Observed activity involving energy & utilities victims is dominated by suspected China-aligned, state-sponsored actors, including Stone Panda, Volt Typhoon, APT41, APT27, Hafnium, Earth Estries, Salt Typhoon, and MISSION2074.
Middle East-aligned state activity is represented by Oilrig, while North Korea-aligned activity appears via Lazarus Group.
Financially motivated intrusion sets, including FIN7, FIN11, and TA505, appear less frequently, indicating a stronger nation-state presence than criminal monetization in the observed campaigns.
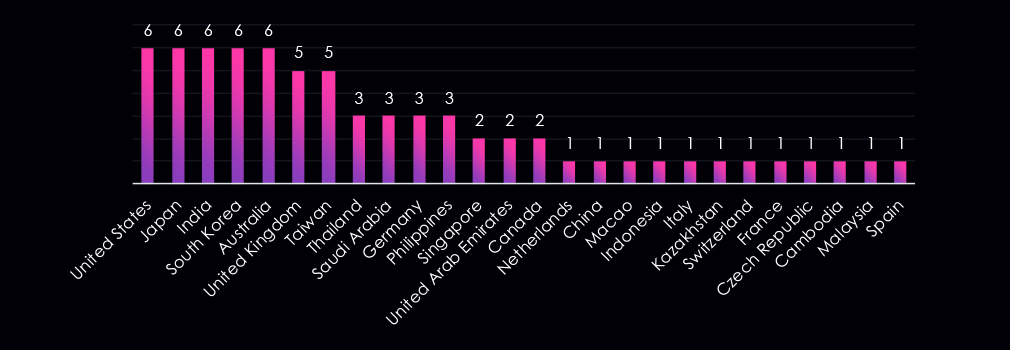
Victim organizations identified in observed energy & utilities sector campaigns were distributed globally, with the highest concentrations observed across Asia-Pacific and Western countries. The United States, Japan, India, South Korea, and Australia were the most frequently affected, each appearing in all six detected campaigns, followed by the United Kingdom and Taiwan.
This geographic distribution aligns with the threat actor composition observed in the same campaigns, which is dominated by suspected China-linked, state-sponsored groups. The prominence of East, South, and Southeast Asian countries is consistent with historical targeting patterns associated with these actors, while repeated activity in the United States, Australia, and parts of Europe reflects the strategic relevance of energy and utilities infrastructure in allied and partner nations.
Additional low-frequency activity across Southeast Asia, the Middle East, and Europe suggests broad campaign reach rather than narrowly scoped regional targeting.
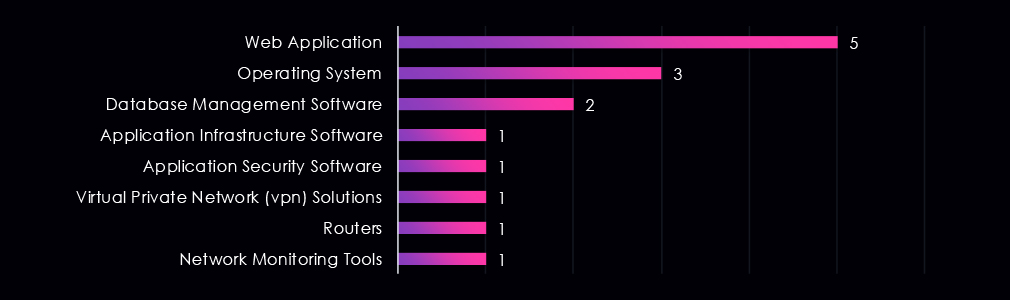
Targeted technologies in observed energy & utilities sector campaigns are mostly externally exposed and foundational systems.
Web applications and operating systems account for the majority of observed targeting, followed by database management platforms.
Lower-frequency targeting of application infrastructure, security tooling, VPN solutions, routers, and network monitoring tools suggests a focus on initial access and persistence within operationally critical environments rather than niche or sector-specific technologies.
Risk Level Indicator: Moderate

Over the past 90 days, the number of observed advanced persistent threat (APT) campaigns has increased and warrants a moderate risk level indicator.
6 out of 14 observed APT campaigns recorded victims in this industry. That is 43% presence in observed campaigns.
That is an increase from the previous 90-day period, during which 2 out of 15 campaigns targeted this industry, also increasing the overall share from the previous 13%.
Monthly Trends
During the last 90 days, most of the activity occurred during January. Preceding November saw no campaigns, December only one, and in just a few days of February, we already see a new campaign, suggesting an uptick will be ongoing into next quarter.
Key Threat Actors
Most TAs were Chinese-linked groups. The second largest category was Russian financially motivated syndicated. North Korean and Iranian groups were behind one campaign each.
Geographical Impact
Victims were identified across a wide geographic range, with the highest concentrations observed in the United States, Japan, India, South Korea, and Australia, each accounting for six detected victims. Additional activity is observed across Europe, the Middle East, and Southeast Asia, indicating broad geographic exposure rather than regionally isolated targeting.
Targeted Technologies
Campaigns focused on a range of enterprise and network technologies, with web applications and operating systems appearing most frequently. Other technology categories appear infrequently, reflecting varied intrusion paths across campaigns rather than reliance on a single dominant technology vector.
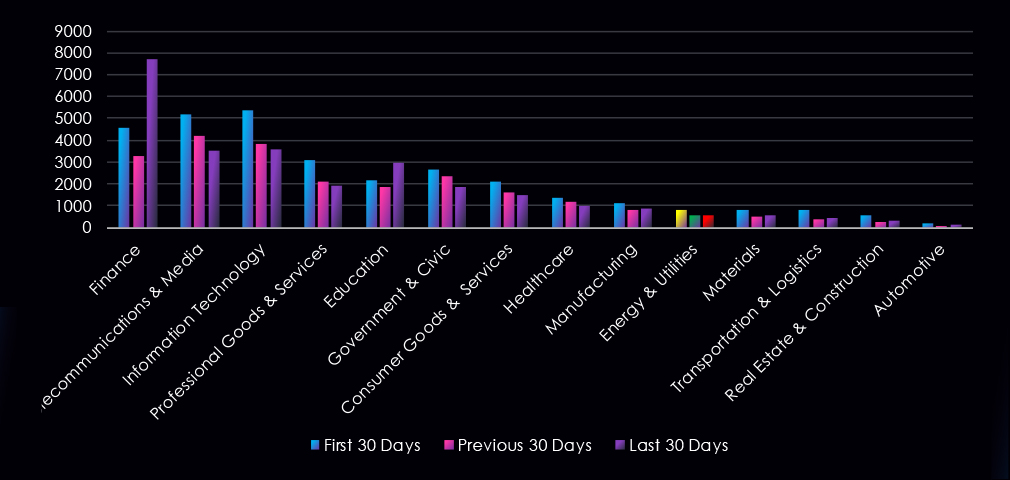
Over the past three months, CYFIRMA’s telemetry has identified 1,950 mentions of the energy & utilities industry out of a total of 80,703 industry-linked mentions. This is from a total of 300k+ posts across various underground and dark web channels and forums.
The energy & utilities industry placed 10th out of 14 industries in the last 90 days, with a share of 2.42% of all detected industry-linked chatter.
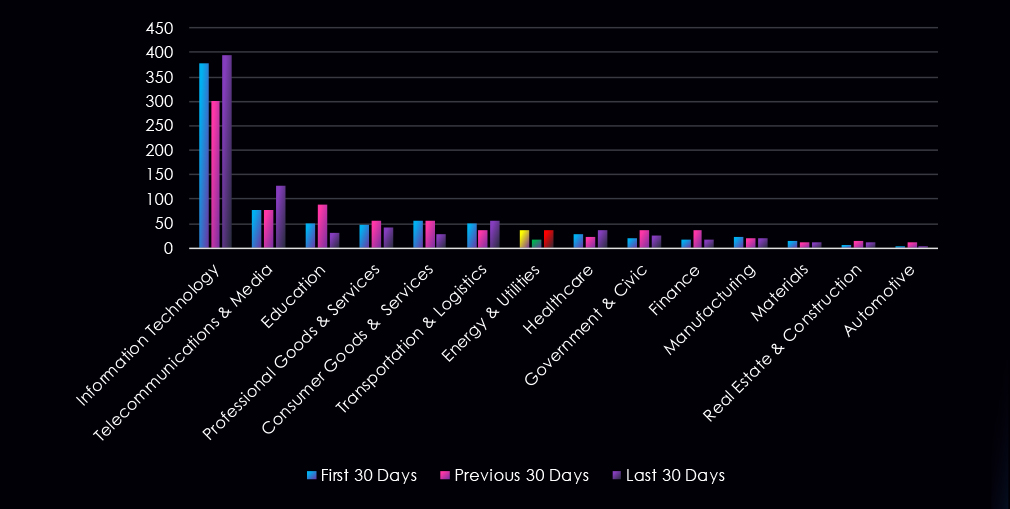
Below is a breakdown by 30-day periods of all mentions.
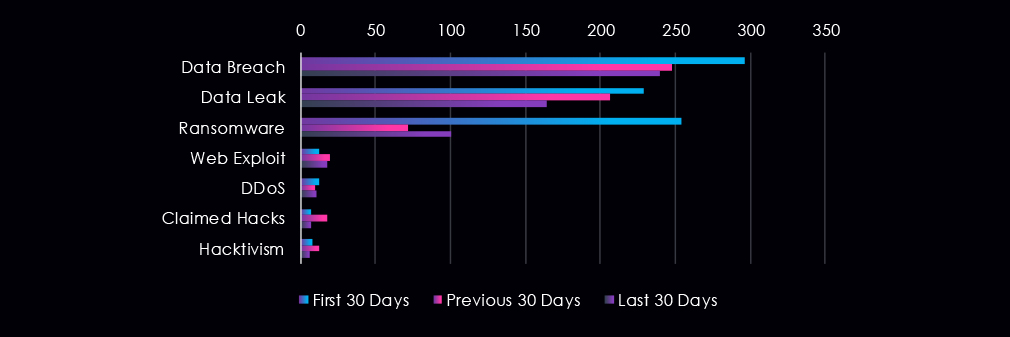
Data Breaches and Data Leaks have been the most talked-about topics in this industry. Both categories have seen a slowdown in discussions over the entire 90-day period. Ransomware after strong first 30 days, declined to less than a third of volume, and then rebounded slightly over the last 30 days. Other categories were only minor, but all except DDoS recorded small upticks in the previous 30 days.
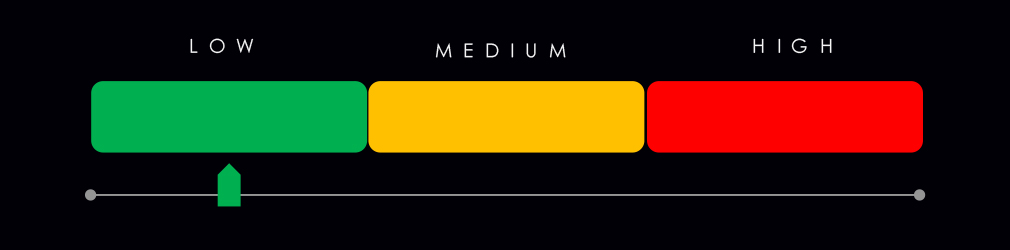
Risk Level Indicator: Low
In total, the energy & utilities industry comprise 2.42% of all detected industry underground and dark web chatter in the last 90 days, ranking 10th out of 14 industries. Below are observed key trends across 90 days:
Data Breach
296 → 248 → 240, High and relatively stable with a slight downward trend. Energy and utility providers continue to be attractive targets due to their critical infrastructure role, though recent periods show a modest reduction in publicly visible breach activity.
Data Leak
229 → 206 → 164, Consistent decline across all periods. Suggests fewer leak postings or reduced public resale of energy-sector data, potentially reflecting a shift toward private access brokerage or improved containment.
Ransomware
254 → 72 → 100, Sharp drop followed by a partial rebound. This pattern indicates ransomware activity remains volatile in the sector, with attackers testing pressure tactics but not sustaining peak levels.
Web Exploit
12 → 20 → 18, Increase from the first period with slight easing. Indicates continued probing of web-facing energy systems, dashboards, and monitoring portals, though not at a large scale.
DDoS
12 → 10 → 11, Low and stable. Suggests limited use of volumetric disruption attacks, with attackers favoring intrusion and extortion over pure availability impact.
Claimed Hacks
7 → 18 → 7, Mid-period spike followed by normalization. Likely reflects a short-lived wave of public claims rather than sustained campaign-level activity.
Hacktivism
8 → 12 → 6, Moderate early activity with a decline in the latest period. Indicates diminishing ideologically motivated targeting of energy entities, though background risk remains.
Over the past three months, CYFIRMA’s telemetry has identified 91 mentions of the energy & utilities industry out of a total of 2,453 industry mentions. This is from over 10k CVEs reported and updated in the last 90 days.
The energy & utilities industry ranked 7th out of 14 industries in the last 90 days, with a share of 3.71% of all detected industry-linked vulnerabilities.
Below is a breakdown by 30-day periods of all mentions.
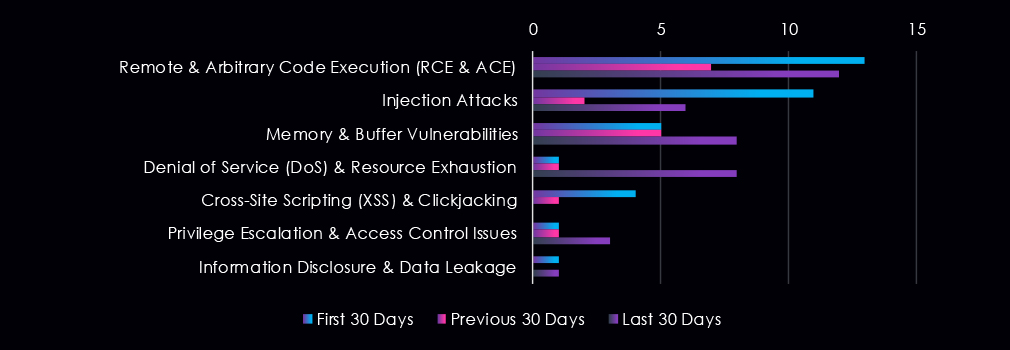
Reported energy & utilities-related CVEs are dominated by remote and arbitrary code execution and injection vulnerabilities across all three 30-day periods. Memory and buffer-related issues remain consistently present, while denial-of-service and resource exhaustion vulnerabilities increase sharply in the most recent period. Other vulnerability classes appear intermittently at low volumes, reflecting variable disclosure patterns rather than sustained shifts in attacker focus.
Risk Level Indicator: Moderate

In total, the energy & utilities industry comprise of 3.71% of all detected industry-linked vulnerabilities in the last 90 days. And ranking 7th out of 14 industries.
Below are observed key trends across 90 days.
Remote & Arbitrary Code Execution (RCE & ACE)
13 → 7 → 12, High and persistent with a brief dip mid-period. RCE remains a dominant disclosure category in energy and utility systems, reflecting continued identification of critical flaws in OT, ICS, and energy management platforms.
Injection Attacks
11 → 2 → 6, Sharp decline followed by a partial rebound. This suggests earlier concentrated research on web and API interfaces, with renewed but lower-intensity disclosure activity in the latest period.
Memory & Buffer Vulnerabilities
5 → 5 → 8, Stable initially, then rising. Indicates growing researcher attention to legacy components and embedded systems common in energy infrastructure, where memory safety issues are more prevalent.
Denial of Service (DoS) & Resource Exhaustion
1 → 1 → 8, Minimal early reporting followed by a significant spike. This increase points to heightened focus on availability risks in critical infrastructure systems, where service disruption can have an outsized operational impact.
Cross-Site Scripting (XSS) & Clickjacking
4 → 1 → 0, Declining to zero. Suggests reduced disclosure of client-side vulnerabilities in web-based energy platforms during the most recent period.
Privilege Escalation & Access Control Issues
1 → 1 → 3, Low but increasing. Reflects emerging disclosures tied to authentication and role management weaknesses in energy-sector software environments.
Information Disclosure & Data Leakage
1 → 0 → 1, Very limited and inconsistent. Indicates isolated findings of exposure-related issues rather than a sustained trend.
In the past 90 days, CYFIRMA has identified 72 verified ransomware victims in the energy & utilities industry. This accounts for 3.32% of all 2,169 ransomware victims during the same period, placing the energy & utilities industry 13th out of 14 industries.
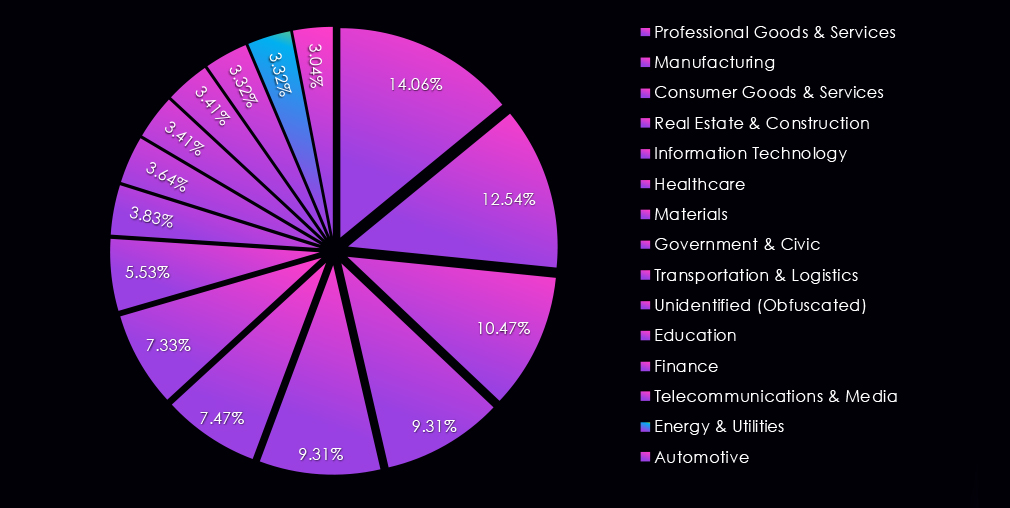
Furthermore, a quarterly comparison shows that interest in energy & utilities organizations jumped significantly. There was an increase of 63.6% from 44 to 72 victims. The overall share also grew from 2.52% to 3.32% of all victims.
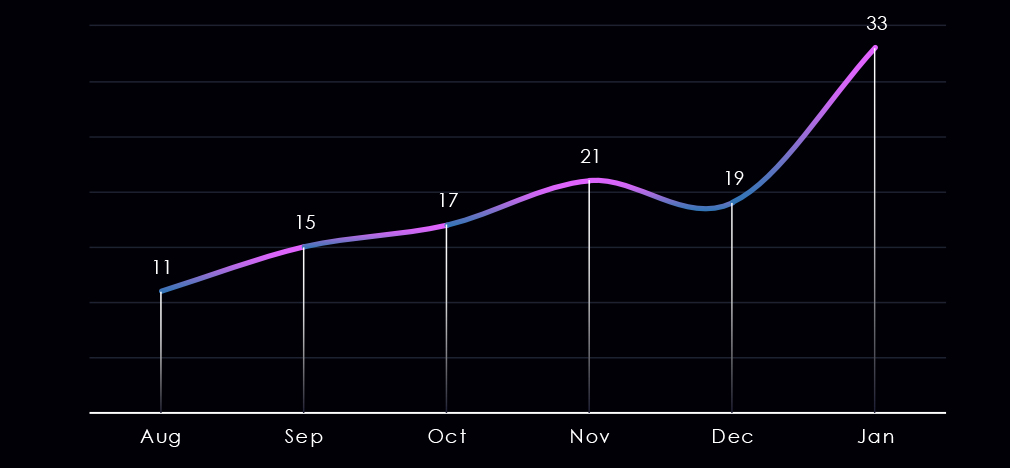
The monthly trendline over the past 180 days shows a slow but steady increase in victims each month, ending with a sharp spike in January. Suggesting an elevated trend into the next quarter.
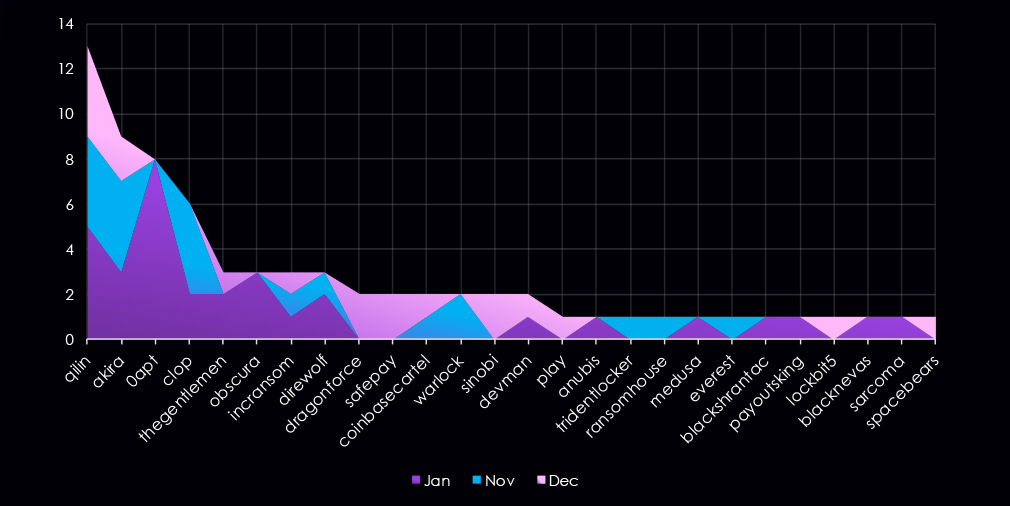
A breakdown of monthly activity per gang reveals which gangs were most active each month. For instance, Qilin and Akira remained active across all months. On the other hand, a new group, 0apt showed up in January and recorded enough victims to rank as the 3rd most active group in this industry.
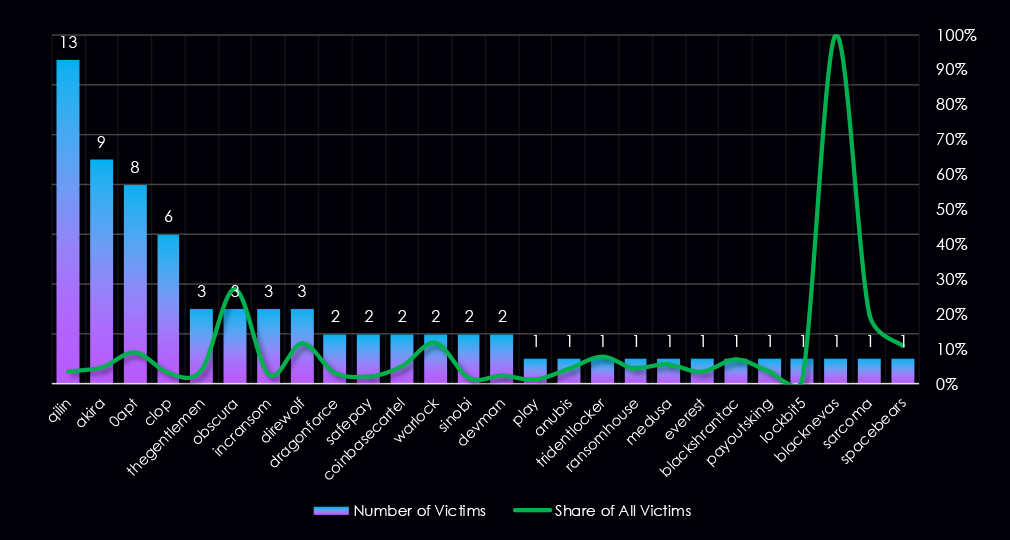
Out of the 68 gangs, 26 recorded victims in the energy & utilities industry in the last 90 days, representing a 38% participation.
Qilin and Akira had the highest number of victims, however, low shares of 3.4% and 4.8% of all their victims. That means their numbers are opportunistic targeting and the large scale of their activity.
Obscura (27%), Direwolf (12%), and previously mentioned 0apt (9%) showed the highest focus on this industry from groups with a meaningful number of victims.
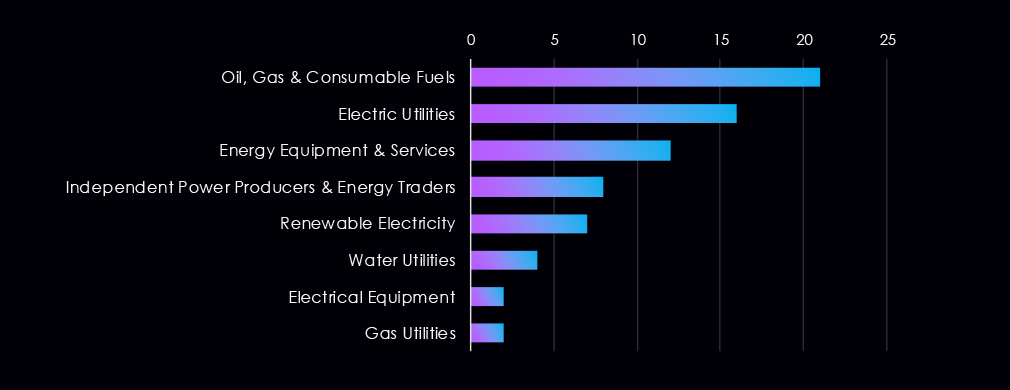
Oil, Gas & Fuels are the most frequent victims of ransomware in this industry. Electric utilities follow in second place, and energy equipment & services in third.
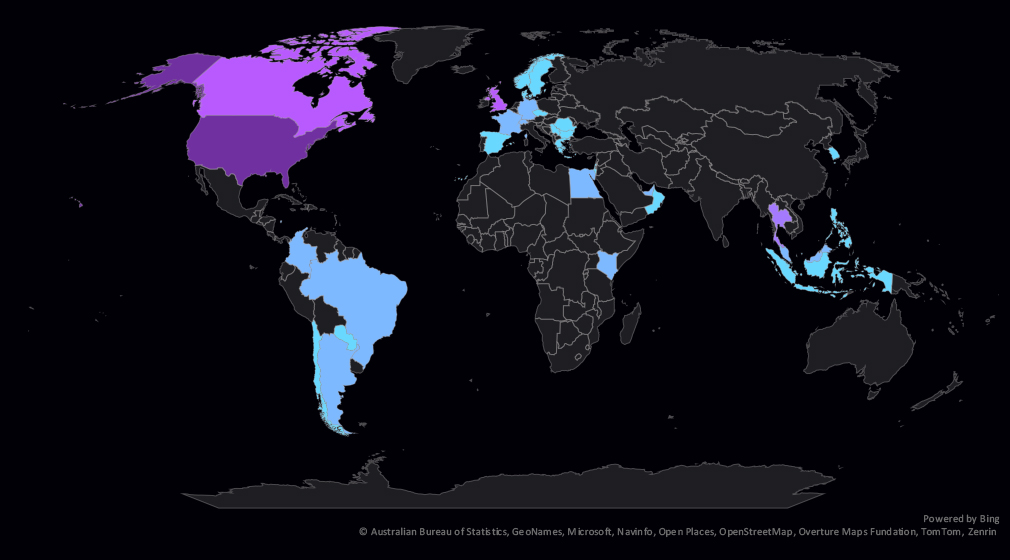
The geographic distribution heatmap underscores the widespread impact of ransomware, highlighting the countries where victims in this industry have been recorded.
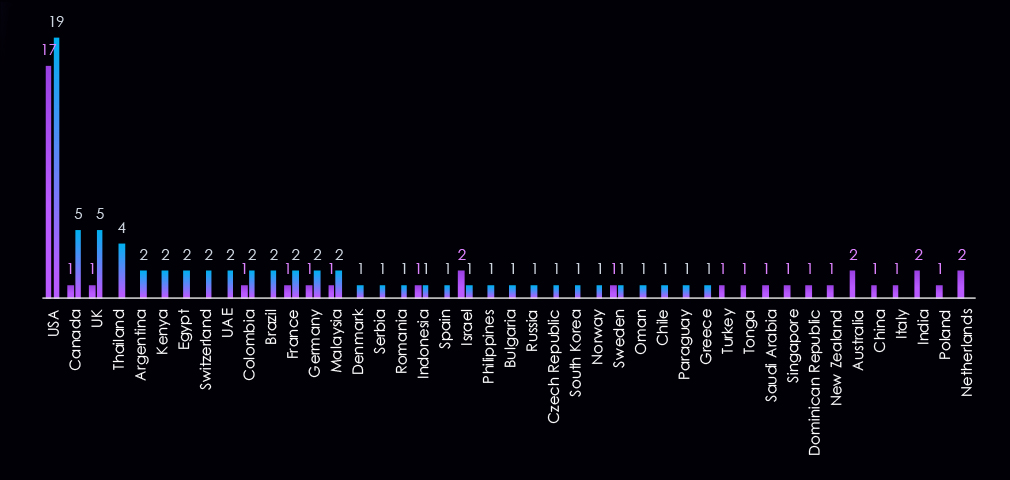
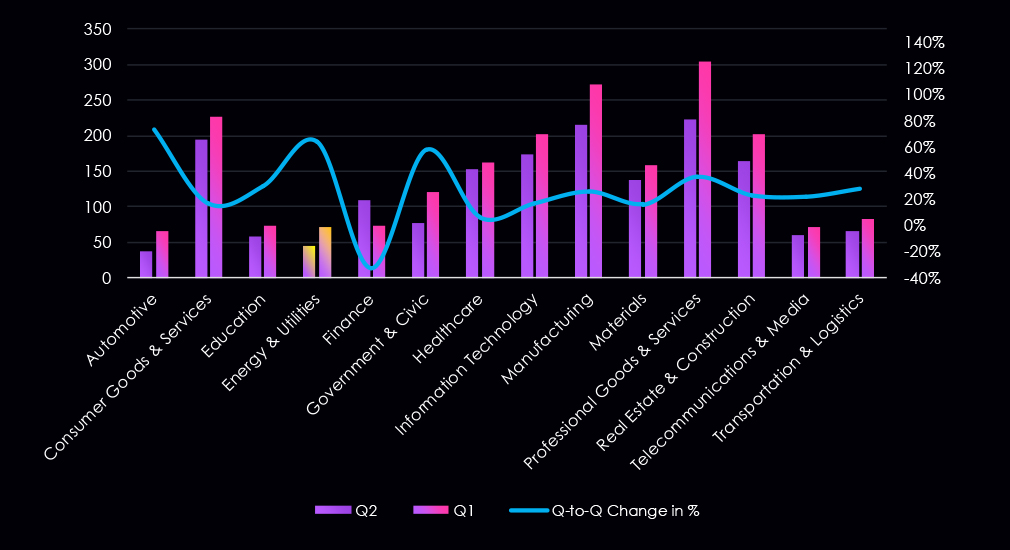
The chart shows quarter-to-quarter changes in targeted countries. Data is sorted by the last 90 days and compared to the previous 90 days, marked in blue.
Energy & utilities victimology shows that a major elevation affected multiple countries and did not affect the USA. Canada, the UK, and Thailand are among the worst hit.
In the last 90 days, 31 countries recorded energy & utilities industry victims, an increase from 22 countries in the previous period.
Risk Level Indicator: Moderate

Energy & utilities ranked 13th out of 14 monitored industries, recording 72 victims in the last 90 days, a major increase of 63.6% from 44 victims in the previous 90-day period.
Overall share also jumped from 2.52% to 3.32% of all ransomware victims.
Despite the 13th lowest victim count, the elevation in activity warrants a moderate risk level indicator.
Monthly Activity Trends
Over the last 180 days, activity grew slowly but steadily each month, until January, when it suddenly spiked.
Ransomware Gangs
A total of 26 out of 68 active ransomware groups targeted this industry in the past 90 days – 38% participation:
Qilin, Akira: Continuously, the most active two gangs. However, their focus on this industry is low. Their victim count is high due to the sheer total volumes of their victims.
0apt: New group appearing in January and quickly became the third most active in this industry. Also, recording a relatively high focus on this industry with 9% share of all victims.
Obscura, Direwolf: Recording 27% and 12% respectively of their victims from this industry, implying energy & utilities are one of their industries of interest.
Geographic Distribution
The geographic distribution of ransomware victims is relatively high, and spread across 31 countries, up from 22 in the previous period.
The sudden uptick in victims did not affect the USA. Canada, the UK, and Thailand recorded the highest increases.
For a comprehensive, up-to-date global ransomware tracking report, please refer to our new monthly “Tracking Ransomware” series here.
APT Campaigns (Moderate): APT activity against energy & utilities increased notably, with 6 of 14 observed campaigns (43%) affecting the sector, up from just 13% in the prior period. Activity clustered heavily in January, following a quiet November and limited December, with early February already indicating continued momentum into the next quarter. Threat actors were predominantly Chinese-linked, followed by Russian financially motivated groups, with isolated activity from North Korean and Iranian actors. Victims were widely distributed, with the U.S., Japan, India, South Korea, and Australia most frequently affected, alongside spillover into Europe, the Middle East, and Southeast Asia. Campaigns relied primarily on web applications and operating systems, but overall intrusion paths varied, suggesting opportunistic rather than uniform targeting.
Underground & Dark Web Chatter (Low): Energy & utilities accounted for 2.42% of underground chatter, ranking 10th. Data breach and leak activity remained elevated but declining, indicating sustained interest in the sector paired with reduced public exposure or resale. Ransomware chatter showed high volatility, dropping sharply before partially rebounding, while web exploit, DDoS, and claimed hack activity stayed relatively low. Hacktivism declined in the latest period, reinforcing the view that financial and access-driven motives dominate current underground activity against this sector.
Vulnerabilities (Moderate): The sector represented 3.71% of disclosed vulnerabilities, ranking 7th. RCE vulnerabilities remained persistent, underscoring ongoing risk in OT, ICS, and energy management platforms. Notably, DoS-related disclosures spiked sharply in the latest period, highlighting growing concern over availability risks in critical infrastructure. Memory and buffer vulnerabilities also increased, reflecting deeper scrutiny of legacy and embedded systems, while injection and XSS findings declined overall.
Ransomware (Moderate): Although ranked 13th by victim count, ransomware impact rose sharply, with 72 victims marking a 64% increase over the prior period and lifting the sector’s overall share to 3.32%. Activity escalated steadily over several months before spiking in January, signaling a clear change in attacker interest. While high-volume gangs such as Qilin and Akira contributed opportunistically, new and niche groups, including 0apt, Obscura, and Direwolf, demonstrated meaningful sector focus. Victim geography expanded to 31 countries, with recent increases concentrated in Canada, the UK, and Thailand, among many others, rather than the U.S., suggesting diversification in targeting strategy.