

The CYFIRMA Industry Report delivers original cybersecurity insights and telemetry-driven statistics of global industries, covering one sector each week for a quarter. This report focuses on the finance organizations, presenting key trends and statistics in an engaging infographic format.
Welcome to the CYFIRMA infographic industry report, where we delve into the external threat landscape of the finance industry over the past three months. This report provides valuable insights and data-driven statistics, delivering a concise analysis of attack campaigns, phishing telemetry, and ransomware incidents targeting financial organizations.
We aim to present an industry-specific overview in a convenient, engaging, and informative format. Leveraging our cutting-edge platform telemetry and the expertise of our analysts, we bring you actionable intelligence to stay ahead in the cybersecurity landscape.
CYFIRMA delivers pre-emptive cybersecurity, cyber threat intelligence, and external threat landscape management through its platforms, DeCYFIR and DeTCT. These platforms have been purpose-built over many years to continuously collect, correlate, and analyse large volumes of external threat data, combining proprietary intelligence automation with deep, hands-on cyber threat research.
For the purpose of this report, the analysis draws on intelligence generated from CYFIRMA’s platforms. The data referenced has been processed through automated correlation and enrichment mechanisms, informed and validated by human-led research and investigative expertise, and sourced from both structured and unstructured external intelligence channels.
While this report contains data collected and processed by our in-house AI and ML, all charts, statistics, and analyses are done by human CYFIRMA CTI analysts to ensure the highest quality and provide accurate insights.
The finance industry featured in 3 out of the 4 observed campaigns, which is a presence in 75% of all campaigns. This is a decline from the previous, more active period, where Finance organizations were present in 7 out of 16 campaigns (44% presence).
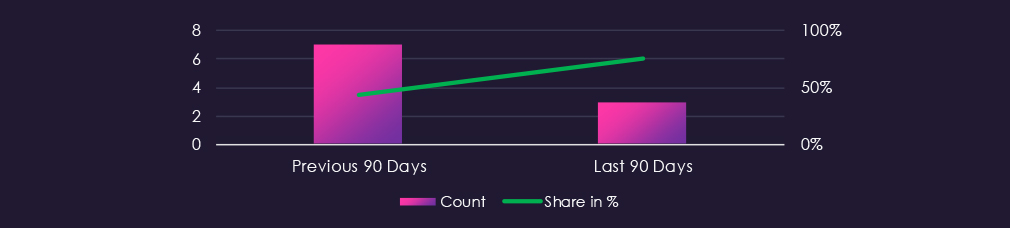

The last 90 days were relatively quiet. 2 out of 3 observed campaigns were detected in October, and since then, only one campaign was observed in December.

Over the past 90 days, observed APT activity against the finance sector was limited in volume and largely concentrated among China-linked actors. Three of the four observed campaigns were attributed to Chinese APT groups, including Volt Typhoon, MISSION2074, and Mustang Panda. These campaigns relied on well-established tradecraft such as stealthy use of legitimate system tools and targeted phishing to gain and maintain access. The remaining activity was attributed to CCTR2501, an internally tracked Turkish-speaking cybercrime group.
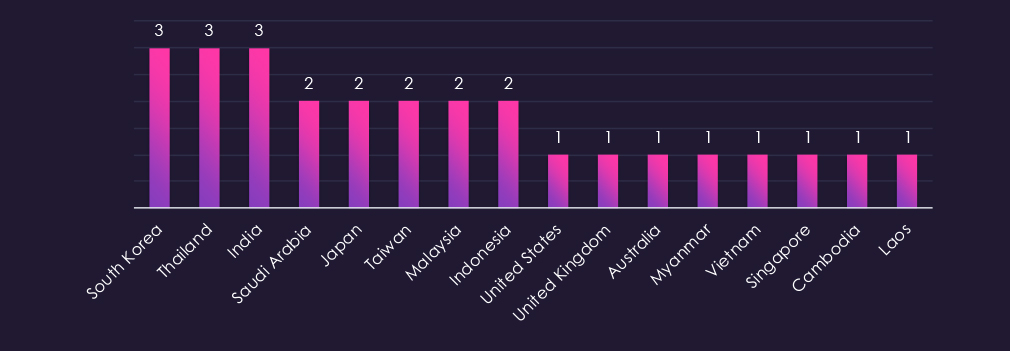
Victim organizations identified in observed finance-sector campaigns were overwhelmingly concentrated in Asia, particularly in East, South, and Southeast Asia. South Korea, Thailand, and India were the most frequently affected, each appearing in the three observed campaigns, followed by Saudi Arabia, Japan, Taiwan, Malaysia, and Indonesia with two incidents each.
A smaller number of cases were identified in Western countries, including the United States, the United Kingdom, and Australia, each with a single observed incident. Additional activity was recorded across Southeast Asia, including Myanmar, Vietnam, Singapore, Cambodia, and Laos.
Overall, the geographic distribution aligns closely with historical targeting patterns of China-linked APT groups.
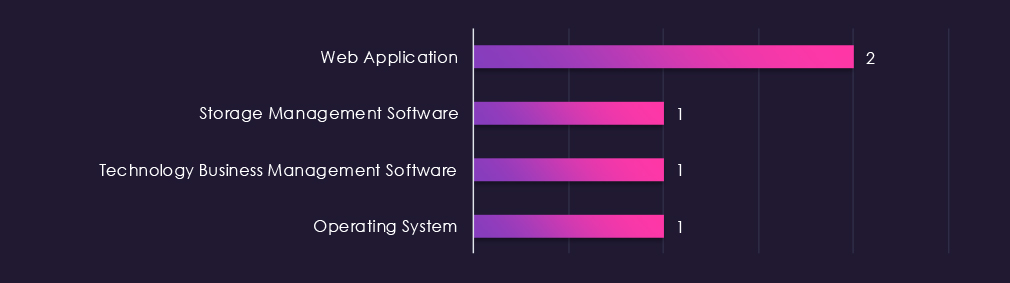
Campaigns targeted a narrow set of technologies, with a clear focus on externally exposed systems. Web applications were the most frequently targeted technology, accounting for two of the observed incidents, reflecting their continued role as an initial access vector in financial environments.
Also targeted were storage management software, technology business management software, and core operating system components, indicating opportunistic exploitation of specialized enterprise platforms rather than broad, indiscriminate targeting.
Risk Level Indicator: Moderate

Over the past 90 days, despite a lower total number of campaigns, the finance industry has been significantly impacted by advanced persistent threat (APT) campaigns.
3 out of 4 observed APT campaigns recorded victims in this industry. That is 75% presence in observed campaigns.
That is a decline from the previous 90-day period, during which 7 out of 16 campaigns targeted this industry, also increasing the overall share from the previous 44%.
Monthly Trends
The last 90 days were overall much calmer than the very highly active previous period. 2 of the campaigns were observed at the tail of the very active period in October. Since then, only 1 campaign was observed during December.
Key Threat Actors
Observed finance-sector APT activity involved four threat actors: the China-linked groups Volt Typhoon, MISSION2025, and Mustang Panda, and one Turkish-speaking cybercrime group tracked internally as CCTR2501.
Geographical Impact
Victims were primarily located in Asia, with the highest concentration in South Korea, Thailand, and India, followed by multiple countries across East, South, and Southeast Asia. A small number of isolated incidents were observed in Western countries, including the United States, the United Kingdom, and Australia, reflecting a largely Asia-focused targeting pattern.
Targeted Technologies
Campaigns focused on a limited set of technologies, most often targeting web applications as the primary entry point.
Additional single incidents involved storage management software, technology business management software, and operating systems, indicating selective targeting of high-value enterprise systems rather than broad-based exploitation.
Over the past three months, CYFIRMA’s telemetry has identified 13,818 mentions of the finance industry out of a total of 83,675 industry-linked mentions. This is from a total of 300k+ posts across various underground and dark web channels and forums.
The finance industry placed 2nd out of 14 industries in the last 90 days with a share of 16.51% of all detected industry-linked chatter.
Below is a breakdown by 30-day periods of all mentions.
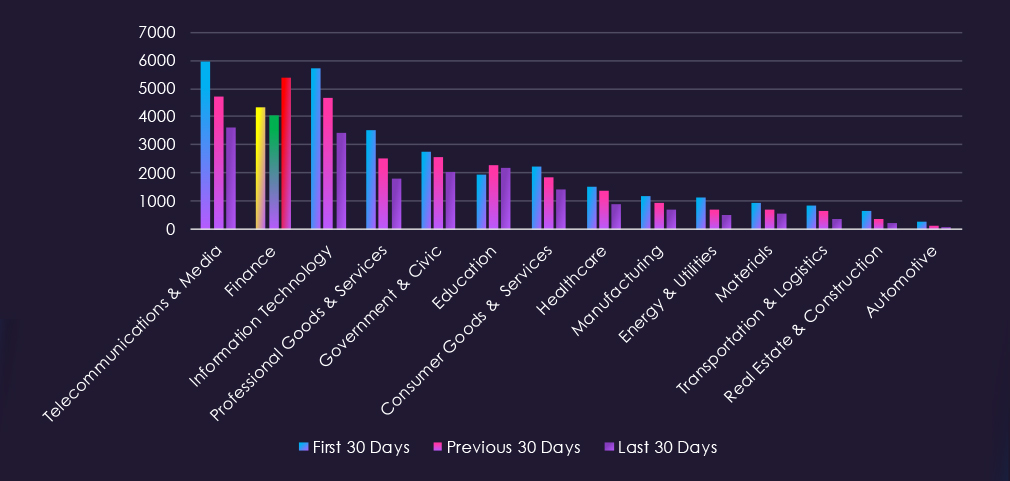
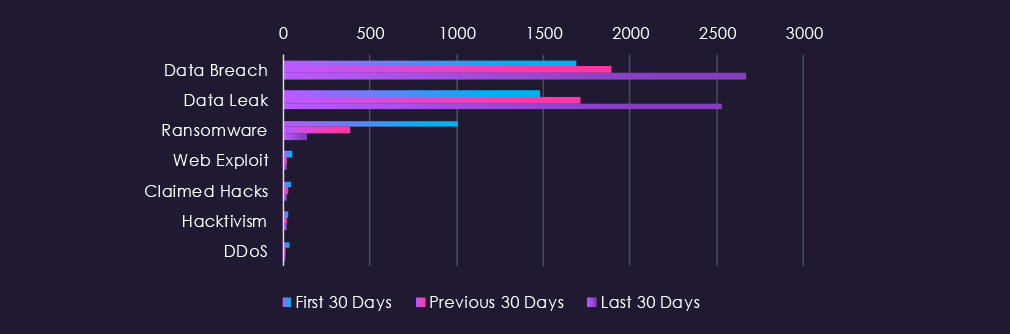
Data Breaches and Data Leaks have been the most talked-about topics in this industry. Both categories have seen a steady rise in discussions over the entire 90-day period, with a particularly sharp increase in the last 30 days. This surge is likely due to the holiday season, during which the finance sector has been in focus. In contrast, the chatter about Ransomware has significantly declined over the past 90 days.
Risk Level Indicator: High

In total, the finance industry comprises 16.5% of all detected industry underground and dark web chatter in the last 90 days, ranking 2nd out of 14 industries. Below are the observed key trends across 90 days:
Data Breach
1693 → 1895 → 2668, Extremely high and accelerating sharply in the latest period. This indicates a surge in successful compromises or disclosures involving financial institutions, likely tied to credential theft, account access, and backend system breaches.
Data Leak
1484 → 1716 → 2531, Mirrors the breach trend with even stronger growth. Suggests large volumes of financial data—customer records, transaction data, and credentials—are being exfiltrated and traded at scale.
Ransomware
1010 → 382 → 135, Dramatic and sustained decline. While ransomware remains a known threat to finance, attackers appear to be shifting away from encryption-based extortion toward quieter data theft and monetization models.
Web Exploit
49 → 20 → 23, Significant drop from the first period with minor stabilization. Indicates fewer publicly discussed web exploitation campaigns, possibly due to stronger defences or attackers favouring credential-based access.
Claimed Hacks
41 → 28 → 18, Gradual decline. Fewer public claims suggest a move away from overt bragging toward private access sales or direct extortion channels.
Hacktivism
26 → 19 → 21, Slight dip followed by stabilization. Ideologically motivated activity remains present but limited, with no large-scale campaigns evident.
DDoS
36 → 11 → 12, Sharp decline and remaining low. Indicates reduced emphasis on disruptive attacks against financial services, likely due to improved mitigation and lower payoff compared to data-centric attacks.
Over the past three months, CYFIRMA’s telemetry has identified 96 mentions of the finance industry out of a total of 2,550 industry mentions. This is from over 10k CVEs reported and updated in the last 90 days.
The finance industry ranked 8th out of 14 industries in the last 90 days, with a share of 3.76% of all detected industry-linked vulnerabilities.
Below is a breakdown by 30-day periods of all mentions.
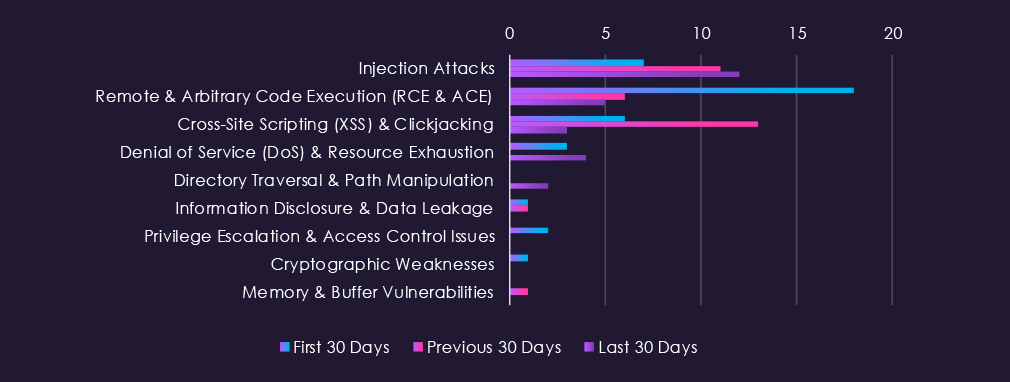
Injection Attacks are the most frequent vulnerability with CVE reports across 90 days. Remote & Arbitrary Code Execution (RCE & ACE) follows in second place, with a large spike in the first 30 days. Cross-Site Scripting (XSS) & Clickjacking are in third place with a spike in CVE reports during the previous 30 days.
Risk Level Indicator: Moderate

In total, the finance industry comprise of 3.76% of all detected industry-linked vulnerabilities in the last 90 days. And ranking 8th out of 14 industries. Below are observed key trends across 90 days.
Injection Attacks
7 → 11 → 12, Gradual and sustained increase. Indicates continued identification of input-handling flaws in financial applications, APIs, and transaction-processing systems, reflecting persistent complexity in secure data validation.
Remote & Arbitrary Code Execution (RCE & ACE)
18 → 6 → 5, Sharp decline after a high starting point. Suggests fewer newly disclosed high-impact execution flaws in recent periods, possibly due to earlier patch cycles or shifting research focus.
Cross-Site Scripting (XSS) & Clickjacking
6 → 13 → 3, Mid-period spike followed by a sharp drop. Likely reflects a concentrated audit or disclosure cycle affecting customer-facing portals, with fewer new findings recently.
Denial of Service (DoS) & Resource Exhaustion
3 → 0 → 4, Low overall but resurfacing in the latest period. Indicates sporadic identification of availability-related weaknesses in financial platforms.
Directory Traversal & Path Manipulation
0 → 0 → 2, Newly appearing in the most recent period. Points to isolated disclosures involving file-handling or misconfiguration issues.
Information Disclosure & Data Leakage
1 → 1 → 0, Minimal and declining. Suggests a few recent findings involving unintended data exposure in financial software.
Privilege Escalation & Access Control Issues
2 → 0 → 0, Limited reporting with no recent disclosures. Indicates relatively few newly identified access-control flaws during this window.
Cryptographic Weaknesses
1 → 0 → 0, Rare and not recurring. When present, these tend to be isolated implementation issues rather than systemic problems.
Memory & Buffer Vulnerabilities
0 → 1 → 0, Very low and inconsistent. These issues are uncommon in the financial sector’s modern application stacks.
In the past 90 days, CYFIRMA has identified 66 verified ransomware victims in the finance industry. This accounts for 3.27% of all 2,016 ransomware victims during the same period, placing the finance industry 12th out of 14 industries.

Furthermore, a quarterly comparison shows that interest in finance organizations shows a significant slowdown. There was a decline of -38.3% from 107 to 66 victims. The overall share also declined from 6.29% to 3.27% of all victims.
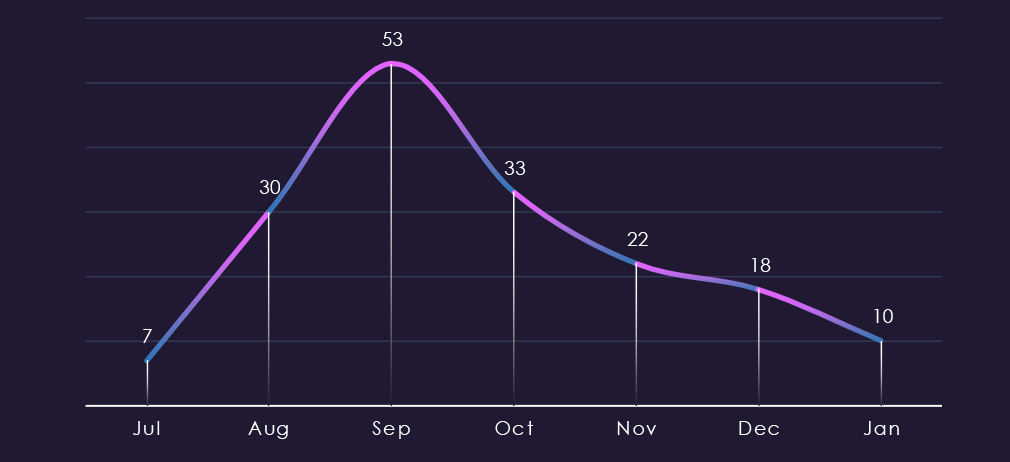
The monthly trendline shows us a dramatic spike during September, when Cl0p ransomware attacked a large number of asset management companies in South Korea. Since then, the activity has gradually tapered down.

A breakdown of monthly activity per gang reveals which gangs were most active each month. For instance, Qilin and Akira remained active across all months. On the other hand, reappearing LockBit5 has been active since December and is already claiming large amounts of victims.
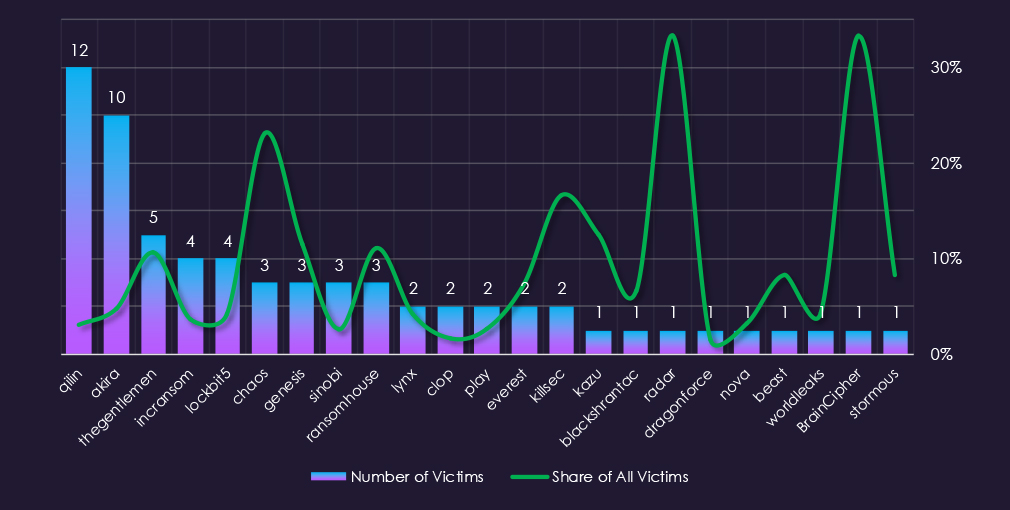
Out of the 68 gangs, 23 recorded victims in the finance industry in the last 90 days, representing a 34% participation.
Qilin and Akira had the highest number of victims; however, they had low shares of 3.0% and 4.8% of all their victims. That means their numbers are opportunistic targeting and the large scale of their activity.
Chaos (23%) and Thegentlemen, Genesis, Ransomhouse (~11%) showed higher focus.

Combined insurance categories are the most frequent victims of ransomware. Investment and asset management firms follow. Commercial and corporate banking is placed in the middle.
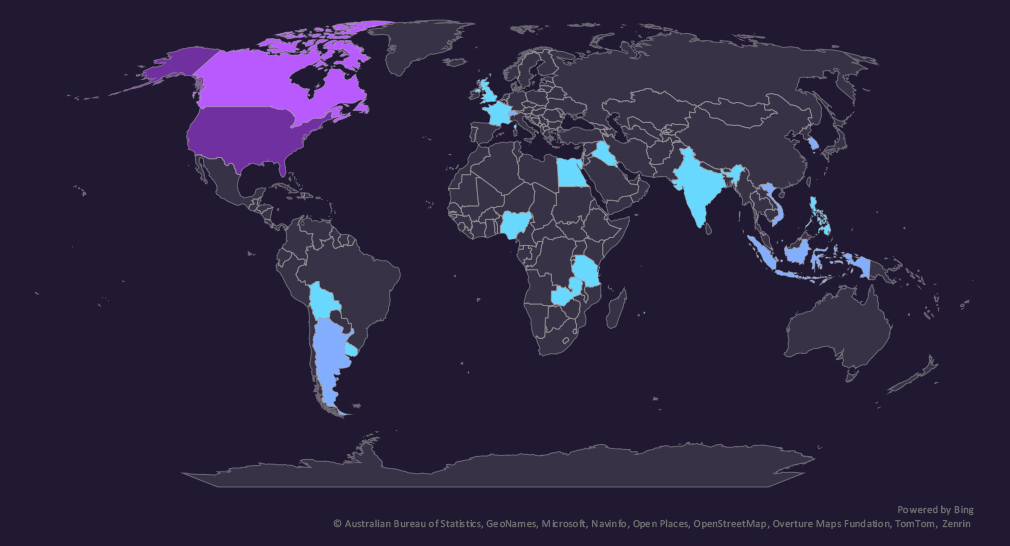
The geographic distribution heatmap underscores the widespread impact of ransomware, highlighting the countries where victims in this industry have been recorded.
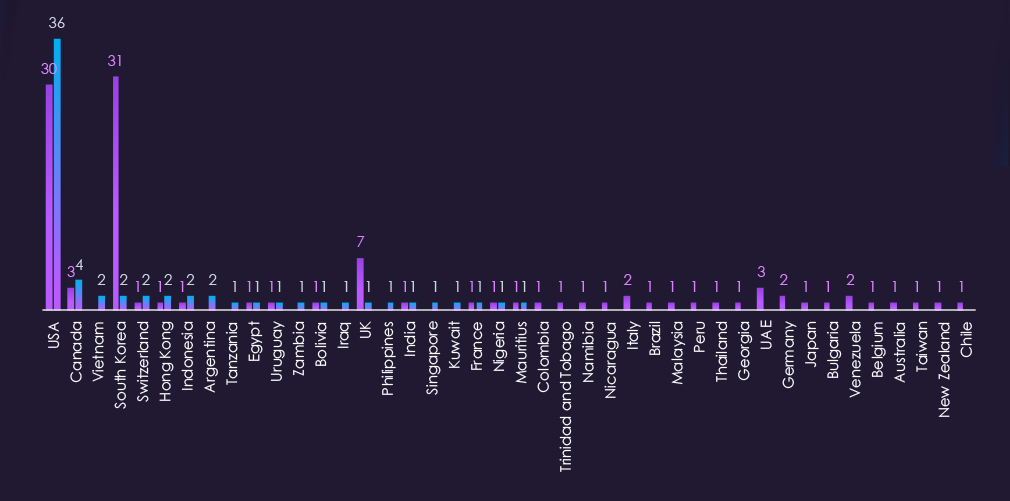
The chart shows quarter-to-quarter changes in targeted countries. Data is sorted by the last 90 days and compared to the previous 90 days, marked in blue.
Finance victimology shows a major decline in South Korea after the Cl0p rampage. The USA continues to be the primary target in this industry, with 55% of all victims.
In the last 90 days, 22 countries recorded finance industry victims, a decline from 34 countries in the previous period.
Risk Level Indicator: Low

The finance industry dropped from 8th to 12th out of the 14 monitored industries, recording 66 victims in the last 90 days, a major decline of -38.3% from 107 victims in the previous 90-day period.
Overall share also mildly decreased from 6.29% to 3.27% of all ransomware victims.
Monthly Activity Trends
Since the major spike in September, driven by Cl0p ransomware attacks in South Korea, the number of finance industry victims has gradually fallen.
Ransomware Gangs
A total of 23 out of 68 active ransomware groups targeted this industry in the past 90 days – 34% participation:
Qilin, Akira: Continuously, the most active two gangs. However, their focus on this industry is low. Their victims counts is high due to the sheer total volumes of their victims.
Chaos: Highest share (23%) among gangs with more than one victim. Suggesting a high focus on this industry.
TheGentlemen, Genesis, Ransomhub: Recording ~11% of their victims from the finance sector, implying finance is one of their industries of interest.
Geographic Distribution
The geographic distribution of ransomware victims is relatively low, and spread across 22 countries, a decline from 34 in the previous period.
The USA recorded 55% of all victims in this industry. The UK saw a decline from 7 to just 1 victim in the last 90 days.
For a comprehensive, up-to-date global ransomware tracking report, please refer to our new monthly “Tracking Ransomware” series here.