
The CYFIRMA Industries Report provides cutting-edge cybersecurity insights and telemetry-driven statistics on global industries. Spanning the last 365 days and highlighting year-over-year changes between 2024 and 2025, this report covers 14 key industries and presents critical trends and data in a compelling infographic format.
This is Part 3 of the report covering only second half of 7 out of 14 industries. If you would like to view the complete report with global trends and all 14 industries detailed breakdown, it is available exclusively on our website.
Welcome to the CYFIRMA Infographic Industry Report, where we examine the external threat landscape across 14 industries over the past year. Through clear, data-driven visuals and expert insights, we present concise analyses of attack campaigns, underground and dark web chatter, reported vulnerabilities, and ransomware incidents affecting organizations worldwide.
Leveraging our cutting-edge platform telemetry and the deep expertise of our analysts, this report highlights detailed industry-specific breakdowns of second half of 7 out of 14 industries.
Our goal is to equip you with actionable intelligence that helps you stay ahead in the ever-evolving cybersecurity landscape.
CYFIRMA delivers pre-emptive cybersecurity, cyber threat intelligence, and external threat landscape management through its platforms, DeCYFIR and DeTCT. These platforms have been purpose-built over many years to continuously collect, correlate, and analyse large volumes of external threat data, combining proprietary intelligence automation with deep, hands-on cyber threat research.
For the purposes of this report, the analysis draws on intelligence generated from CYFIRMA’s platforms. The data referenced has been processed through automated correlation and enrichment mechanisms, informed and validated by human-led research and investigative expertise, and sourced from both structured and unstructured external intelligence channels.
While this report contains data collected and processed by our in-house AI and ML, all charts, statistics, and analyses are done by human CYFIRMA CTI analysts to ensure the highest quality and provide accurate insights.
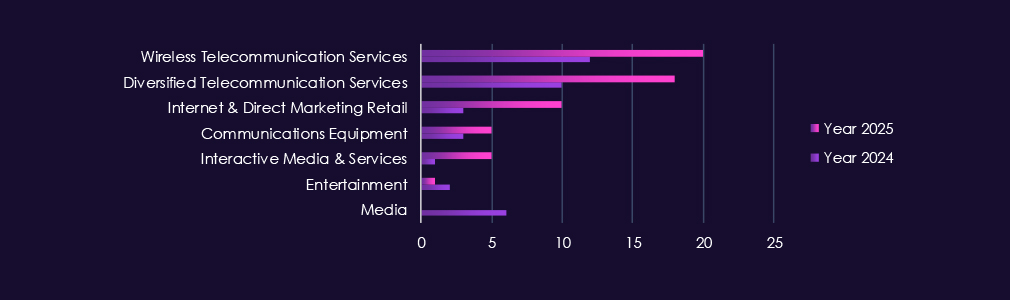
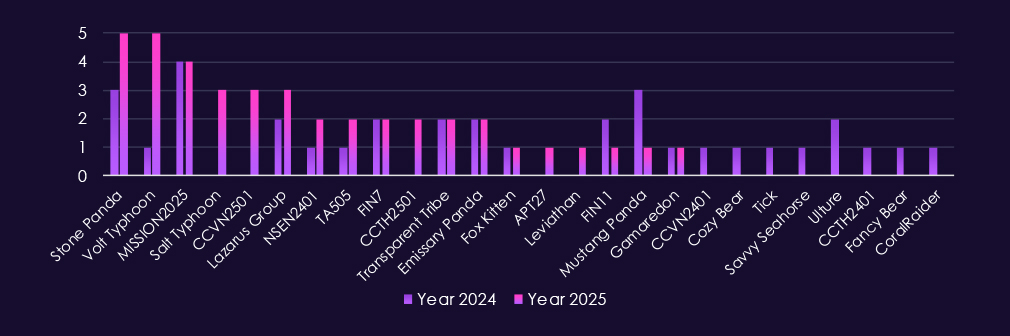
Over the past year, the telecommunications & media industry has been affected by 28 out of the 43 Advanced Persistent Threat (APT) campaigns observed, resulting in a significant incidence rate of 65%. A substantial increase compared to the 16 campaigns in 2024.
The victims of these campaigns have spanned various segments within the industry, as illustrated below:
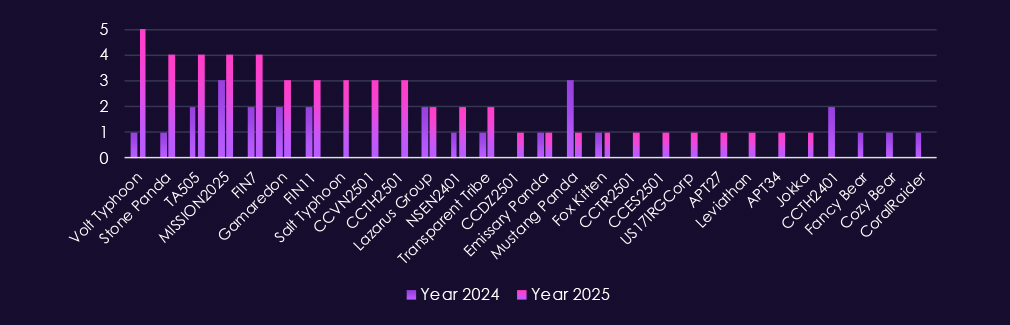
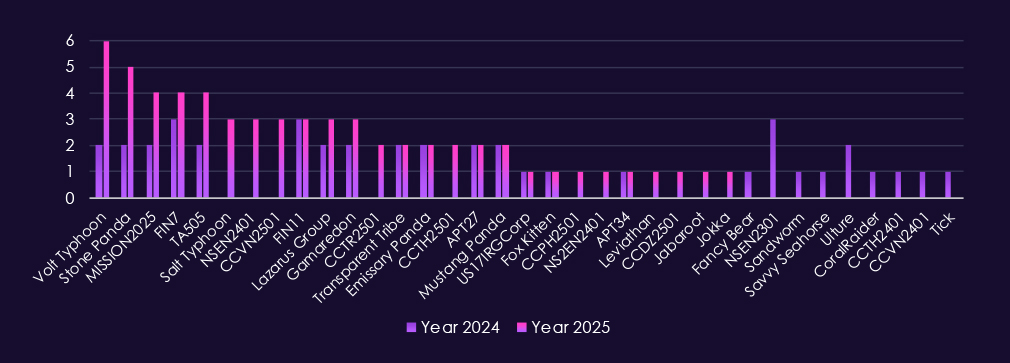
This industry is targeted by a mix of nation-state and financially motivated threat actors, reflecting its importance for communications infrastructure, information access, and downstream intelligence value. In 2025, activity is led by China-aligned groups including Volt Typhoon, Salt Typhoon, Stone Panda, MISSION2025, Mustang Panda, APT27, and Emissary Panda.
At the same time, financially motivated cybercrime groups such as FIN7, TA505, and FIN11 remain active, consistent with ransomware, fraud, and resale of access obtained through service providers. Lazarus Group continues to operate in the sector, reflecting both strategic intelligence and revenue-generation objectives.
Additional activity from Russia – and Iran-linked actors – including Gamaredon, Transparent Tribe, Fox Kitten, and APT34 – highlights the sector’s appeal for espionage and regional influence operations. The growing presence of newly tracked CC- and NS-prefixed groups in 2025 signals a rise in both the sophistication and regional diversity of threat actors targeting telecommunications and media-focused campaigns..
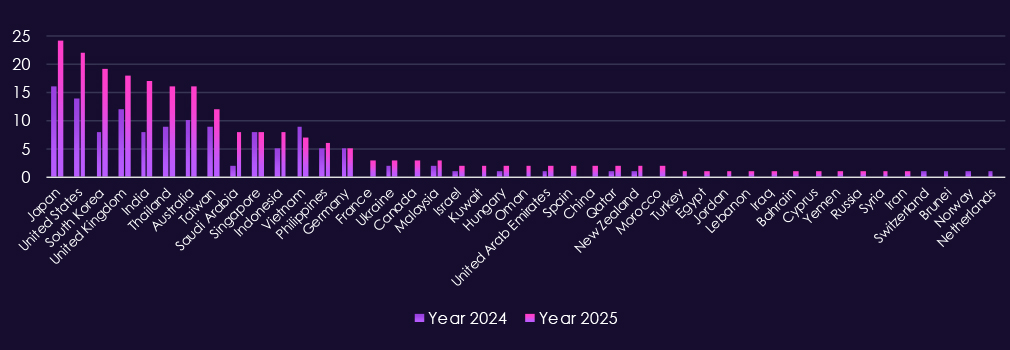
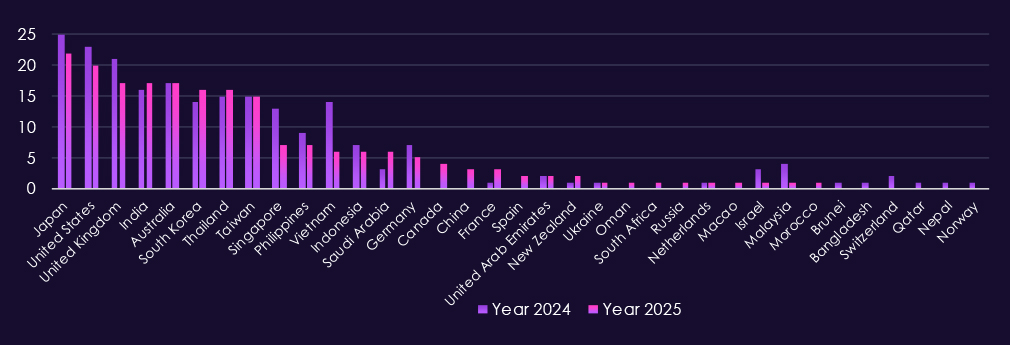
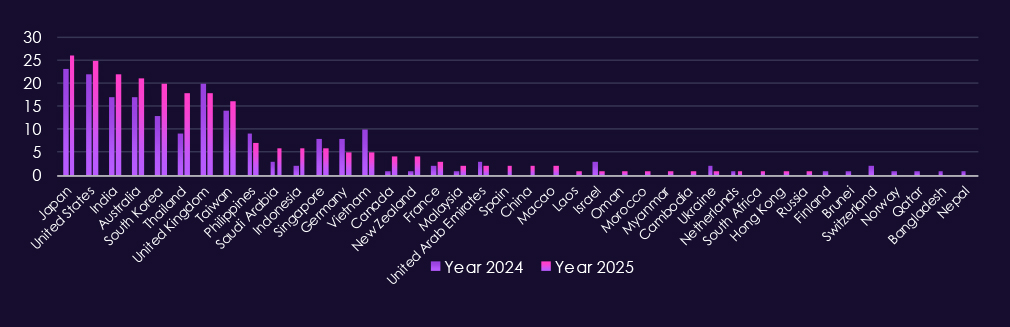
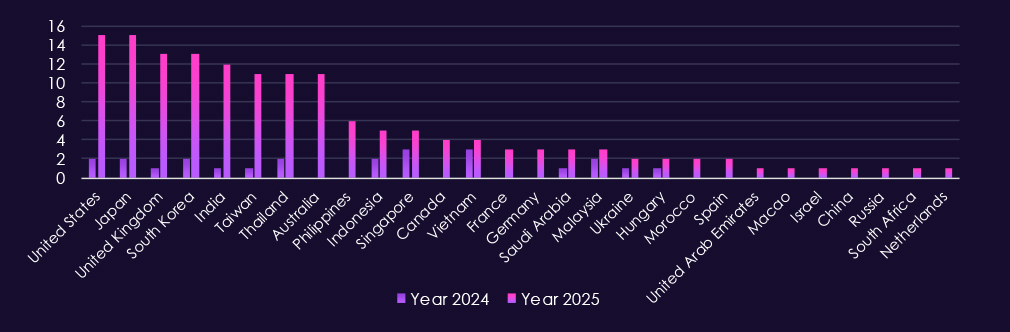
Victim geography is broad and increasingly international in 2025, with the highest observed volumes in Japan, the United States, South Korea, the United Kingdom, India, Australia, Thailand, and Taiwan. Southeast Asia remains consistently represented, reflecting regional infrastructure growth and frequent exposure of internet-facing services. There is also a wider Middle East footprint in 2025, consistent with targeting of regional carriers, broadcasters, and supporting IT providers. Europe shows steady activity, indicating the sector is being targeted as both an information source and a network choke point rather than a single-country problem.
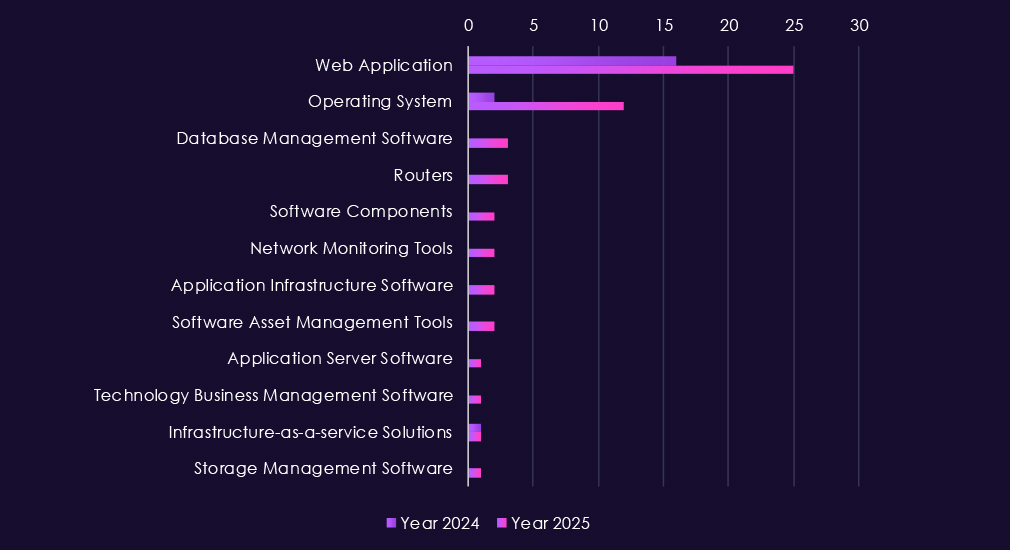
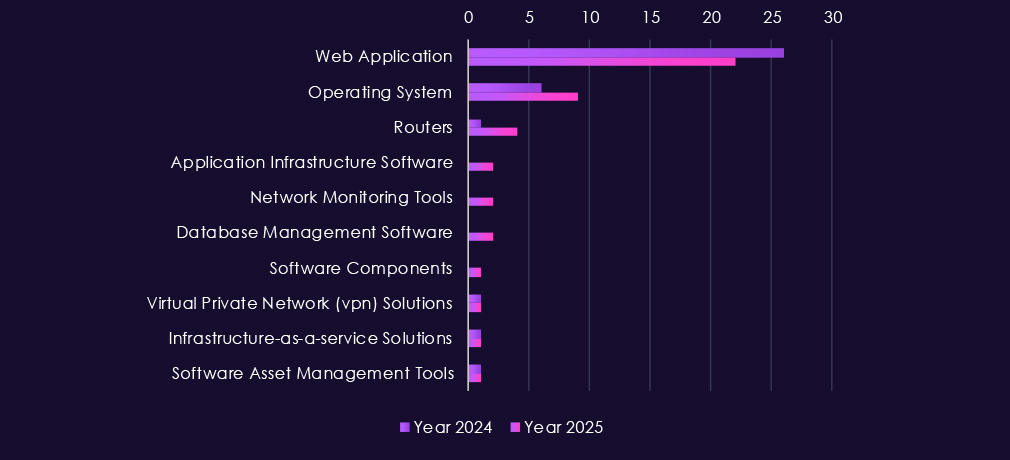
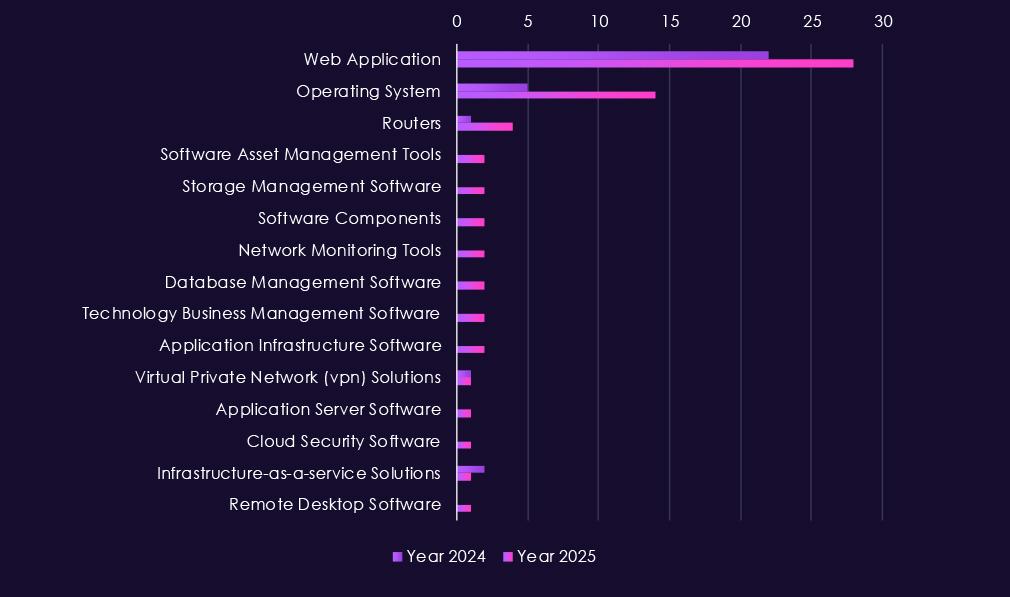
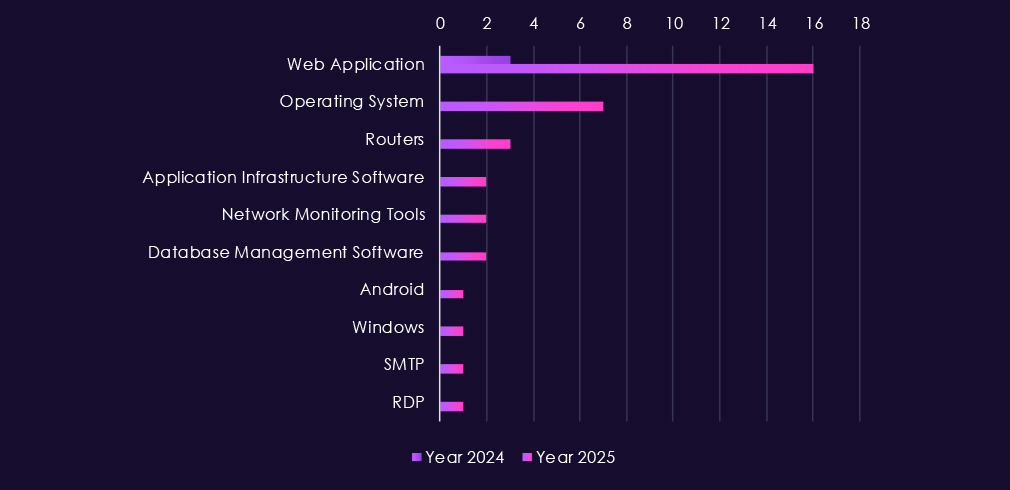
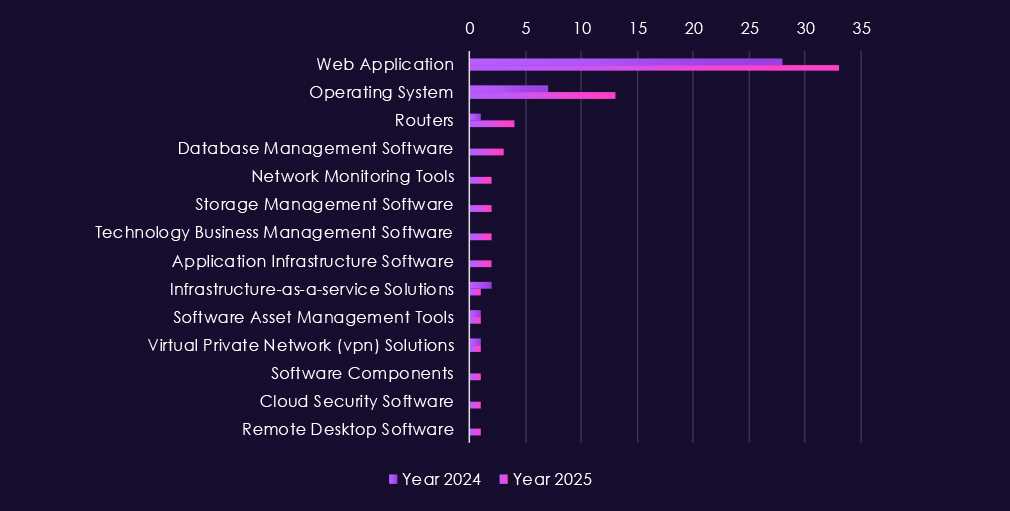
Attacks against the telecommunications & media sector continue to focus on highly exposed enterprise and service-provider technologies, with web applications clearly remaining the primary entry point. Their dominance reflects widespread use across customer portals, content platforms, advertising systems, and operational support applications that are routinely internet-facing.
In 2025, there is a marked increase in operating system targeting, indicating greater emphasis on persistence, lateral movement, and control after initial compromise. Activity also expands into application servers, application infrastructure, and database management systems, suggesting attempts to reach subscriber data, internal content systems, or network-support platforms. More selective targeting of routers and network monitoring tools points to interest in traffic visibility and network control, while incidents involving software components, asset management tools, and cloud infrastructure services indicate abuse of trusted platforms rather than purely perimeter-facing services.
Overall, the technology mix shows campaigns moving beyond simple web exploitation into backend and management layers, consistent with both espionage-driven access and mature cybercrime operations targeting telecommunications & media environments.
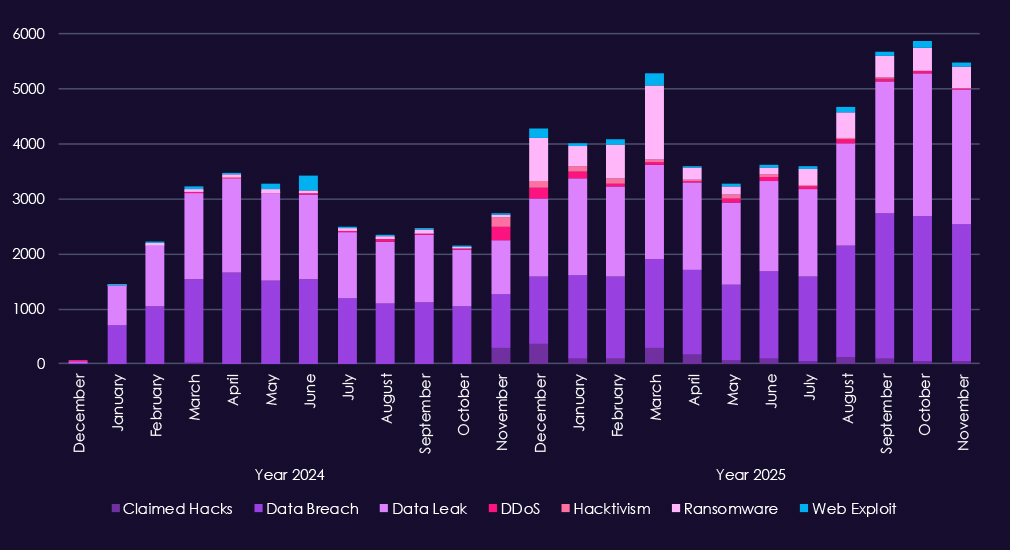
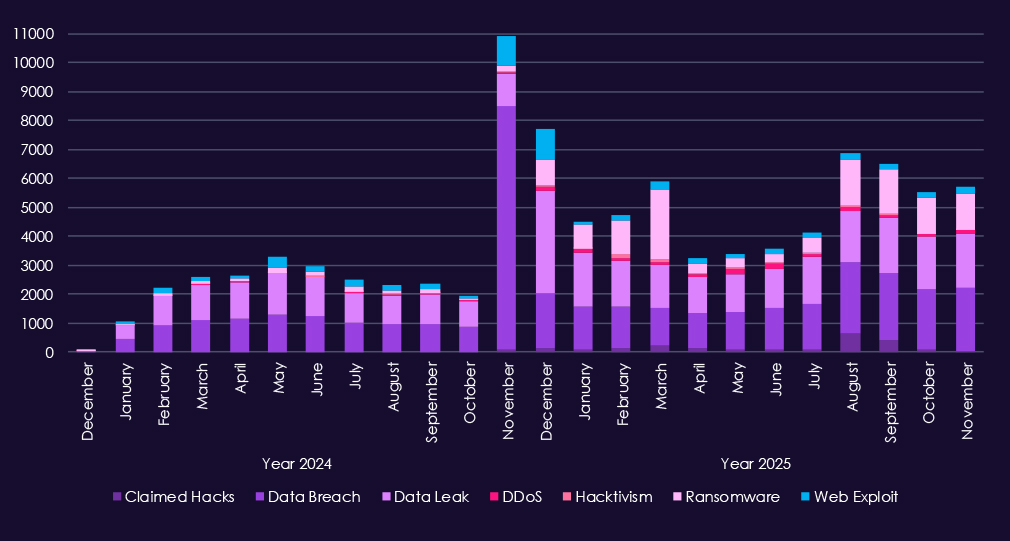
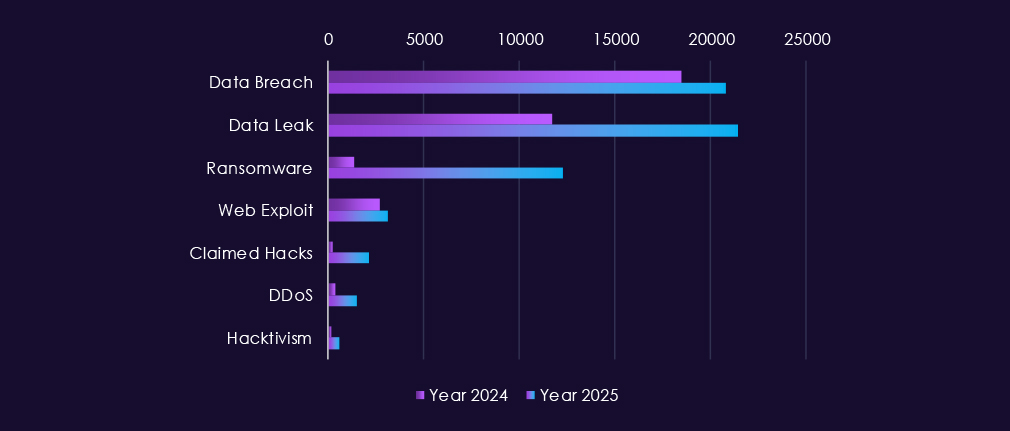
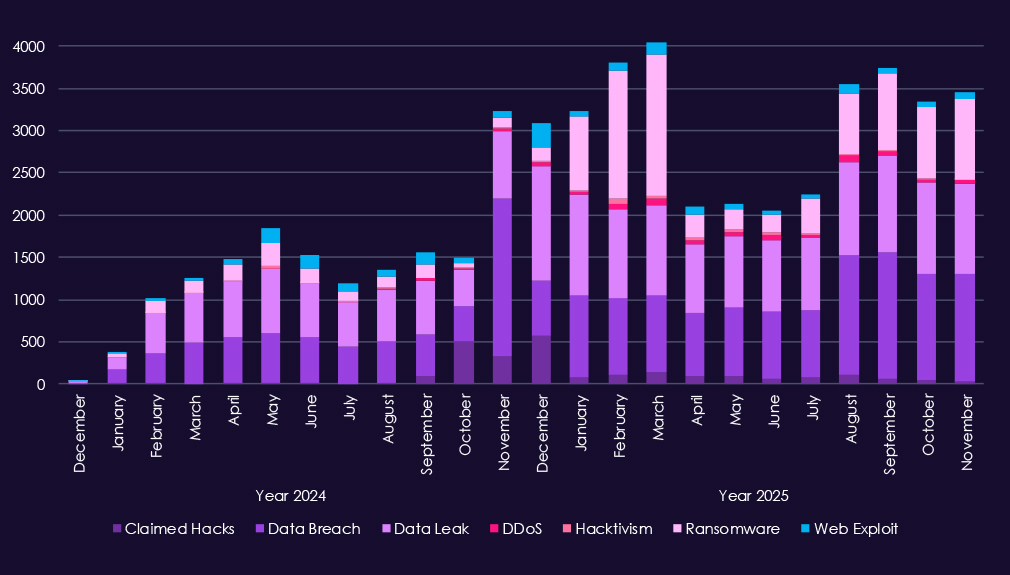
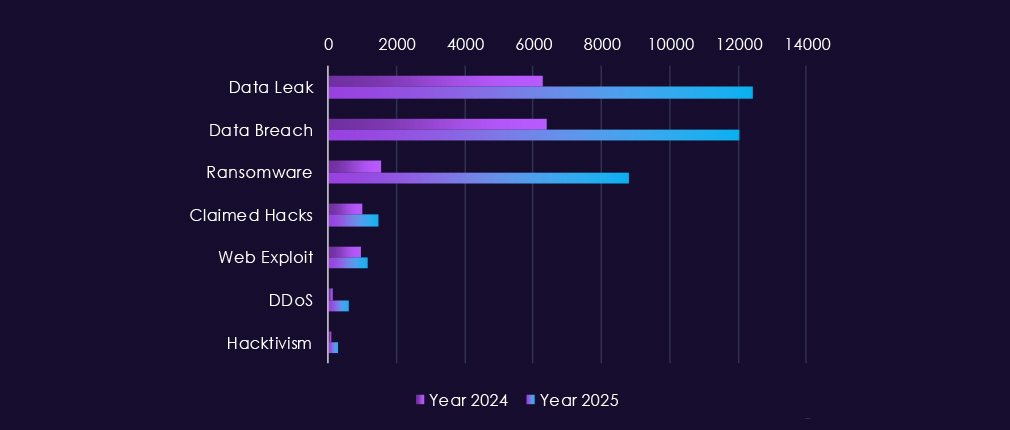
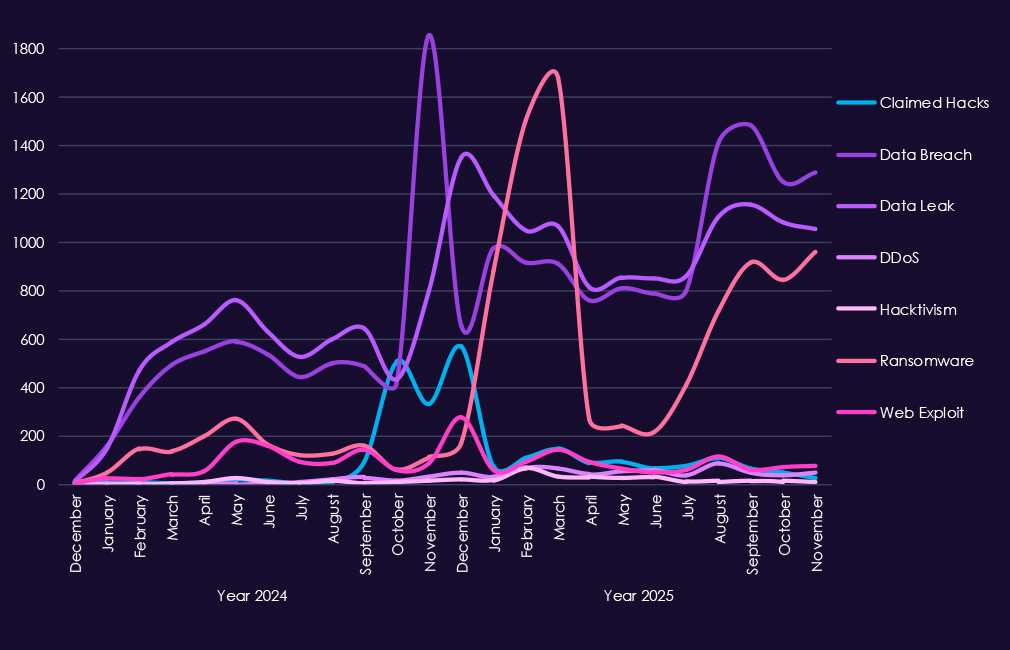
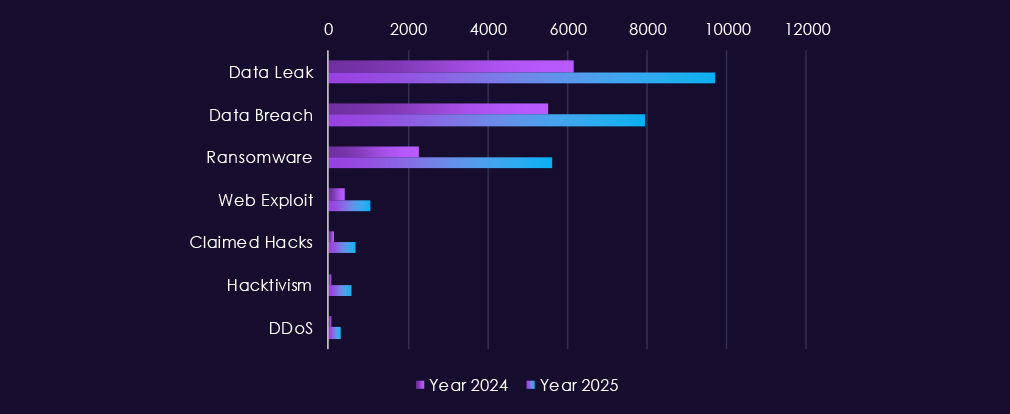
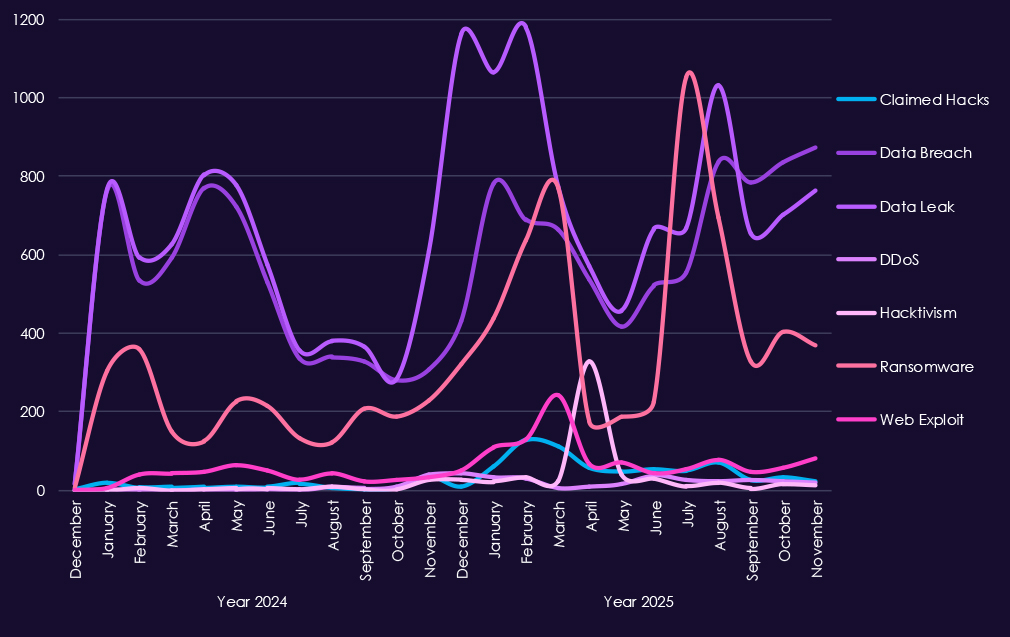
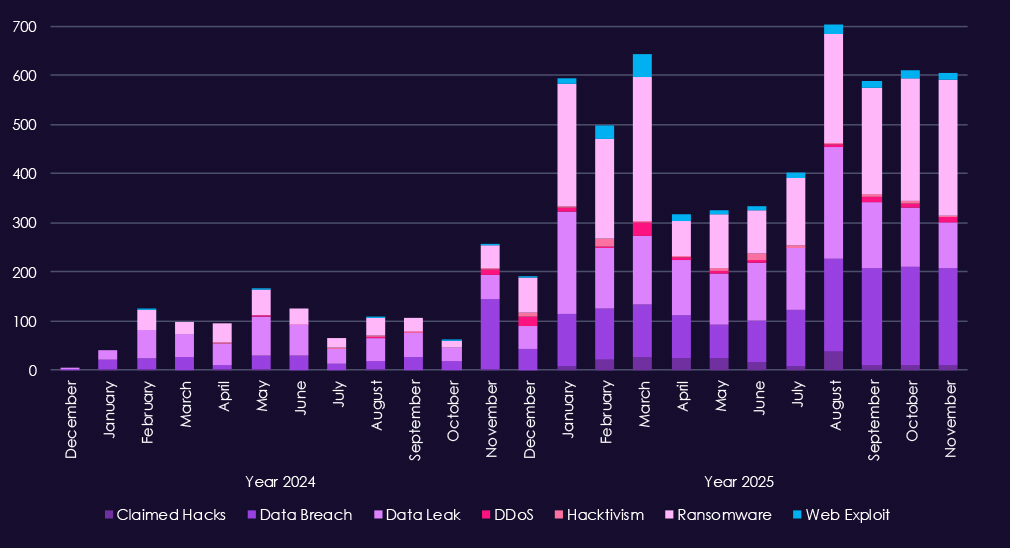
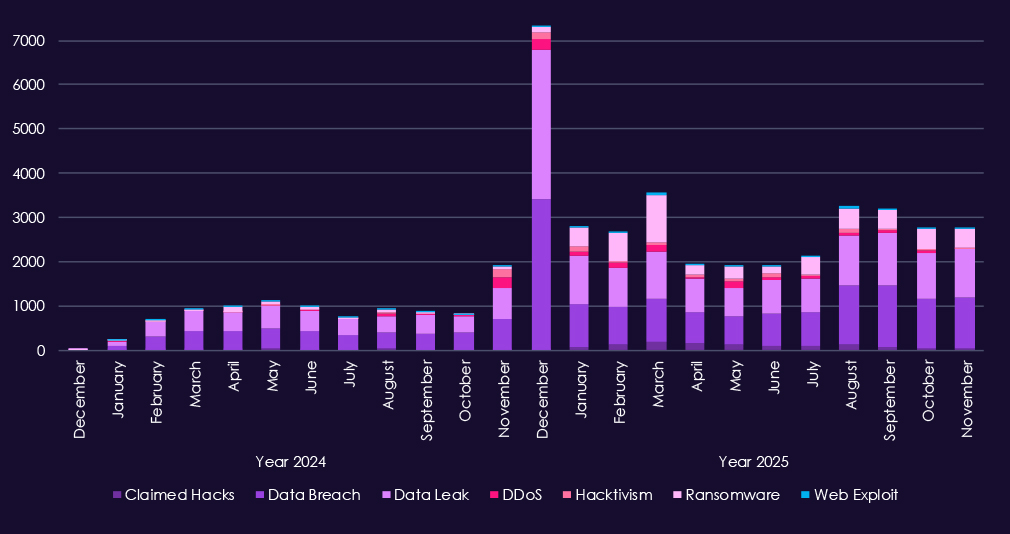
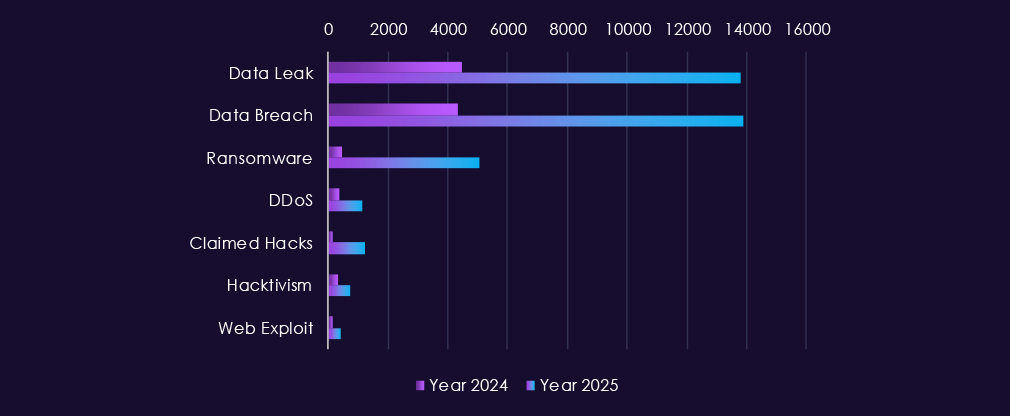
Over the past 23 months, CYFIRMA’s telemetry has identified 82,760 telecommunications & media industry-linked mentions. This is from total of 2.5 million posts across various underground and dark web channels and forums.
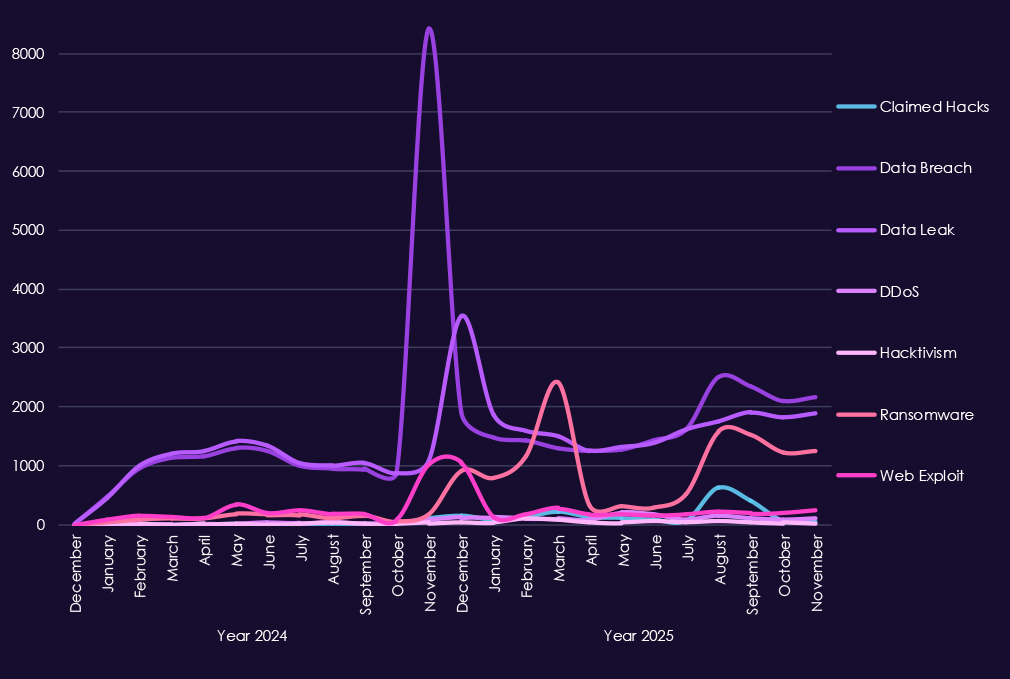
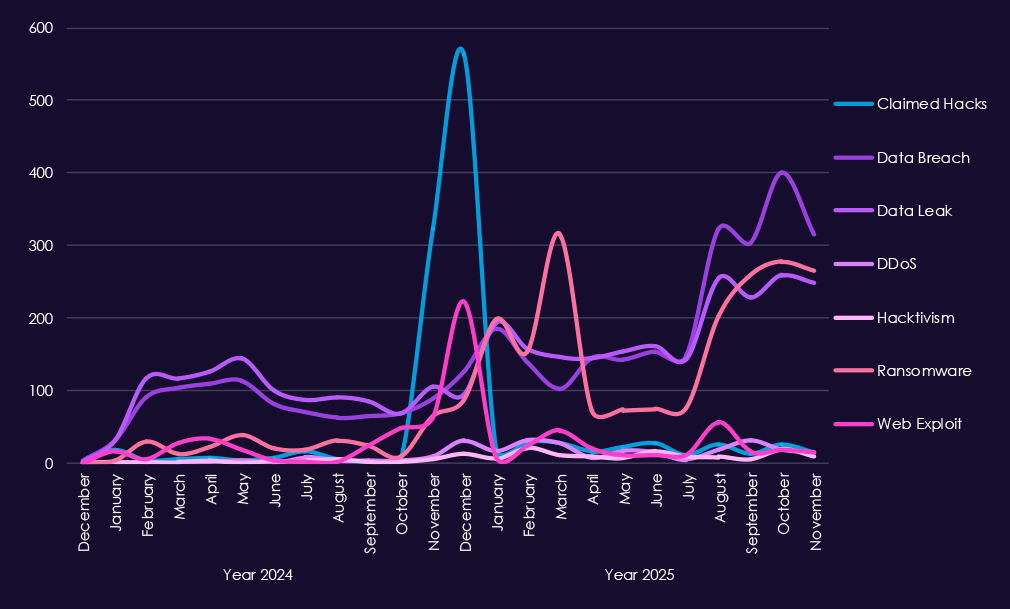
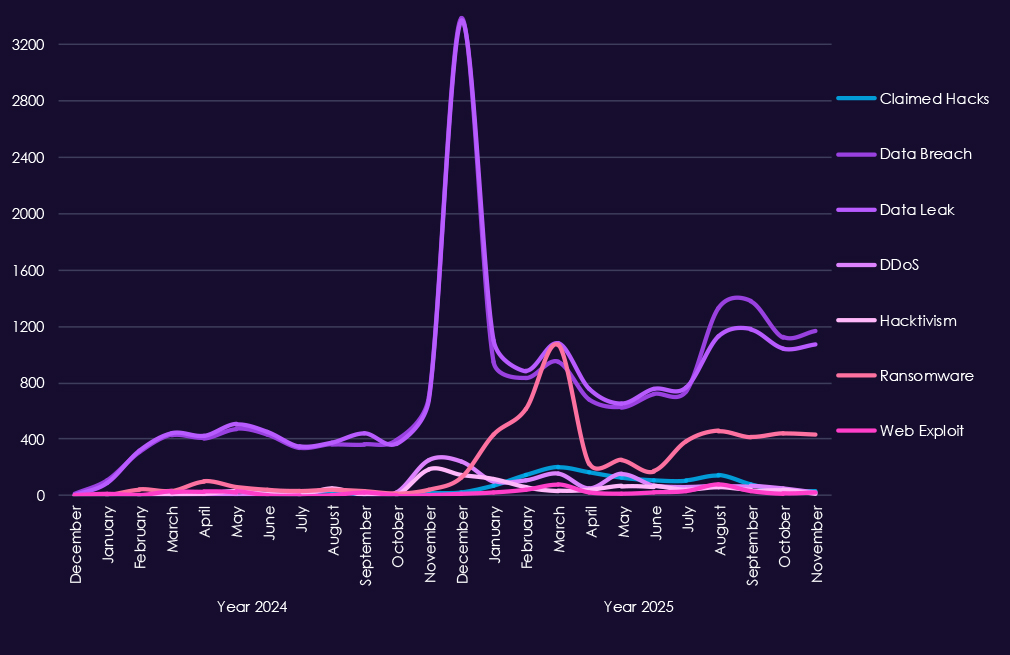
The chart above shows total counts of industry-linked mentions for telecommunications & media industry and individual categories of context for the mentionsThe chart below shows year-over-year growth for each category in this industry.
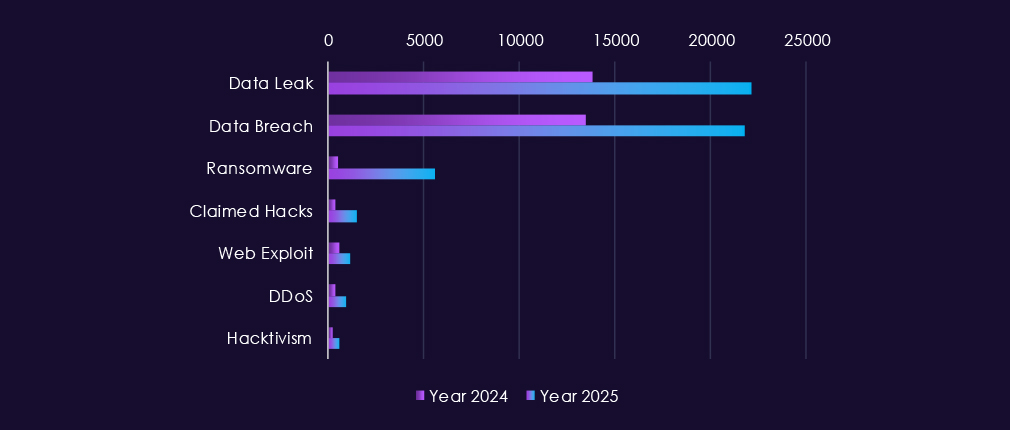
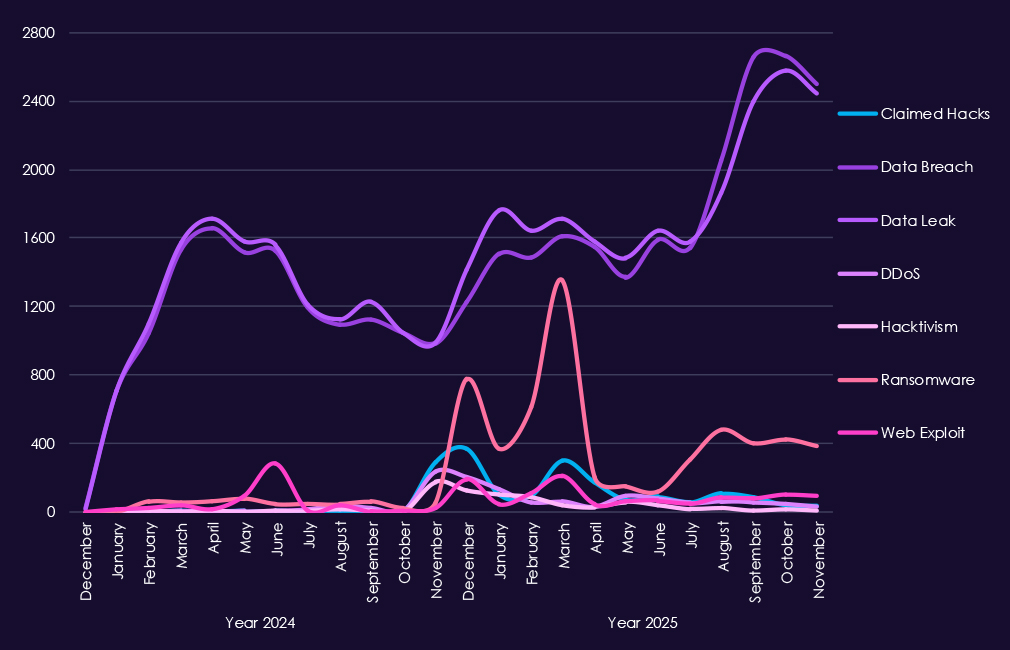
Underground and dark web chatter linked to the telecommunications & media sector remains extremely high through 2025, reflecting both sustained attack activity and frequent public exposure of incidents. Data breaches and data leaks dominate discussion by a wide margin, with consistently elevated volumes month to month. This reflects the nature of industry as essential part of cyberspace infrastructure, hence alongside with information technology being among the most prominent industries linked to underground & dark web chatter.
Ransomware-related chatter shows pronounced volatility but clear escalation in 2025, with sharp spikes early and mid-year following already elevated levels in late 2024. This aligns with continued extortion pressure against telecom operators and media companies, where service disruption and data theft carry high leverage. Mentions of claimed hacks and web exploits also increase significantly, suggesting active advertising of access and exploitation, often tied to credential abuse or vulnerable internet-facing systems.
DDoS and hacktivism activity remain highly visible but uneven, with short-lived surges rather than sustained campaigns, consistent with protest-driven or attention-seeking operations layered on top of broader criminal activity.
Overall, the chatter pattern reflects a sector under persistent, high-volume pressure, dominated by data exposure and ransomware narratives, with disruption-oriented activity appearing opportunistically rather than as the primary driver.
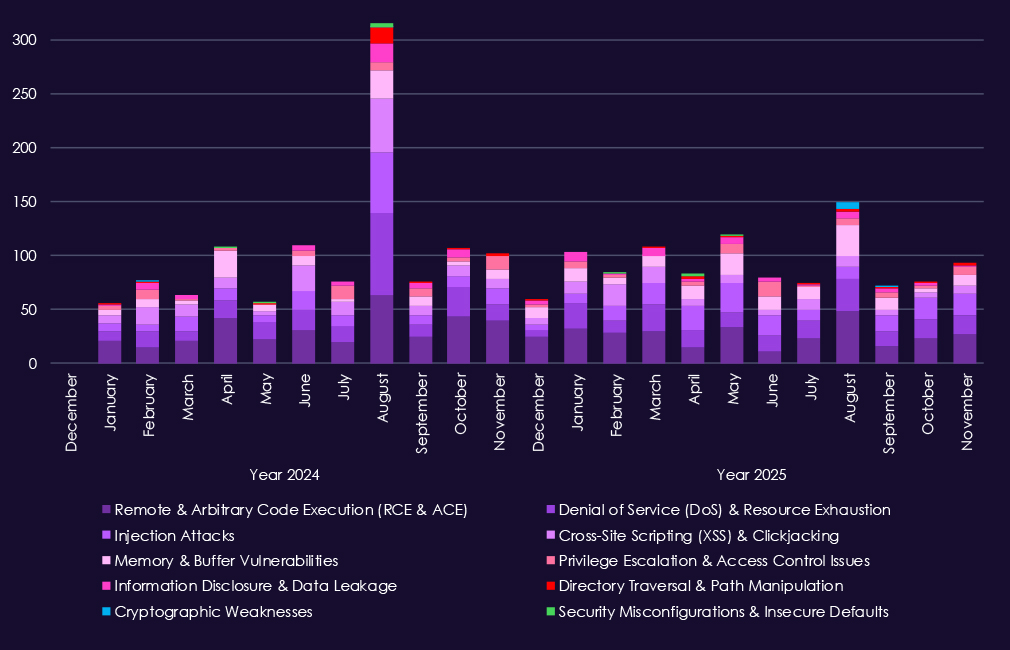
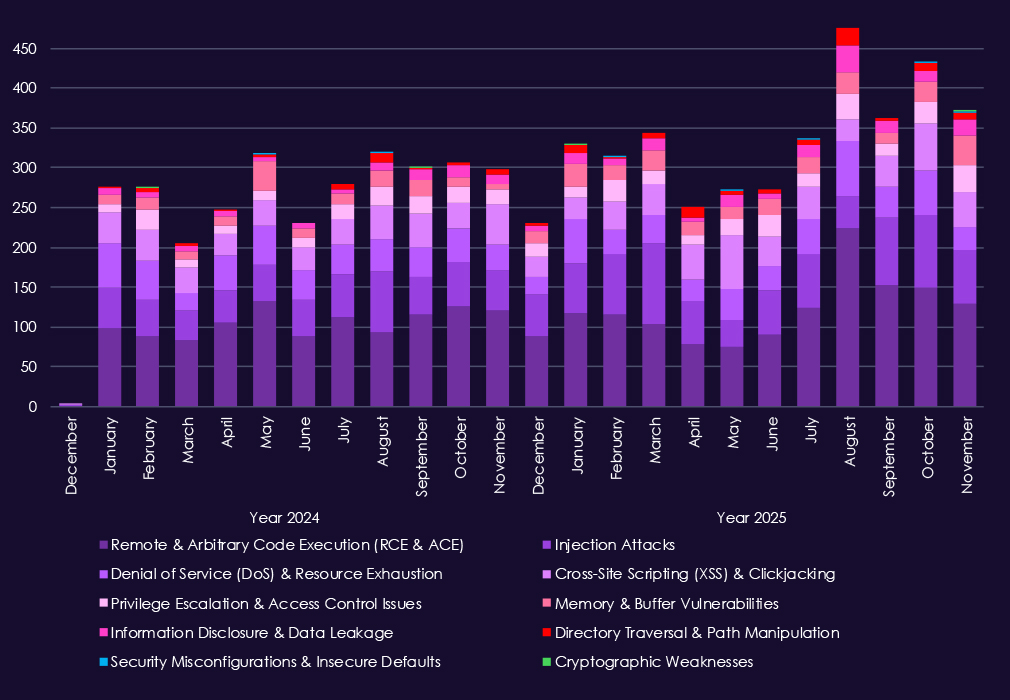
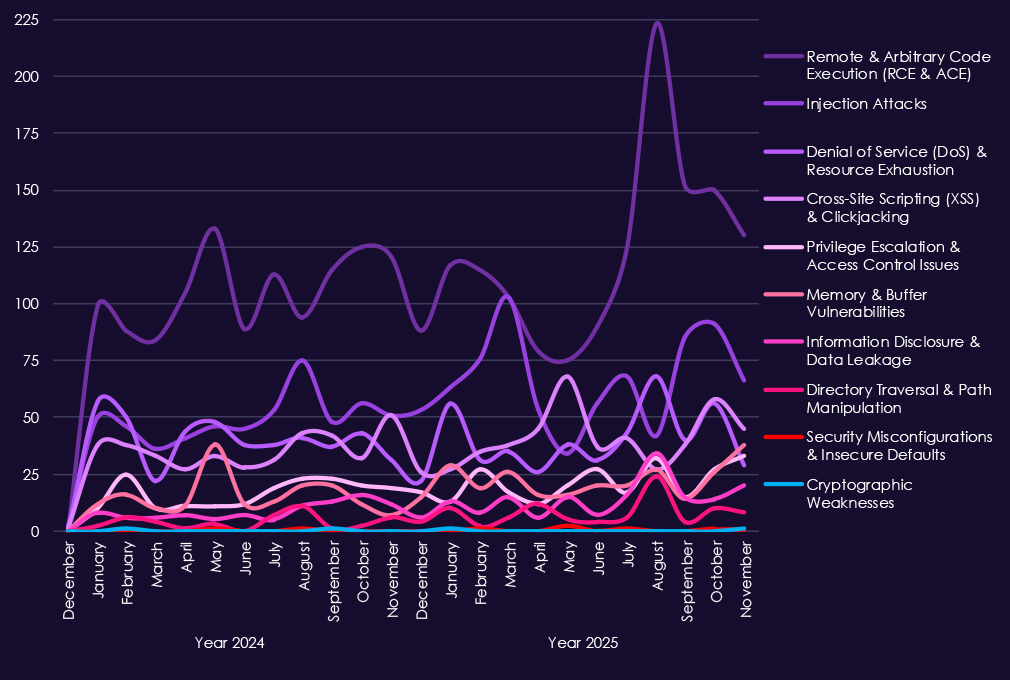
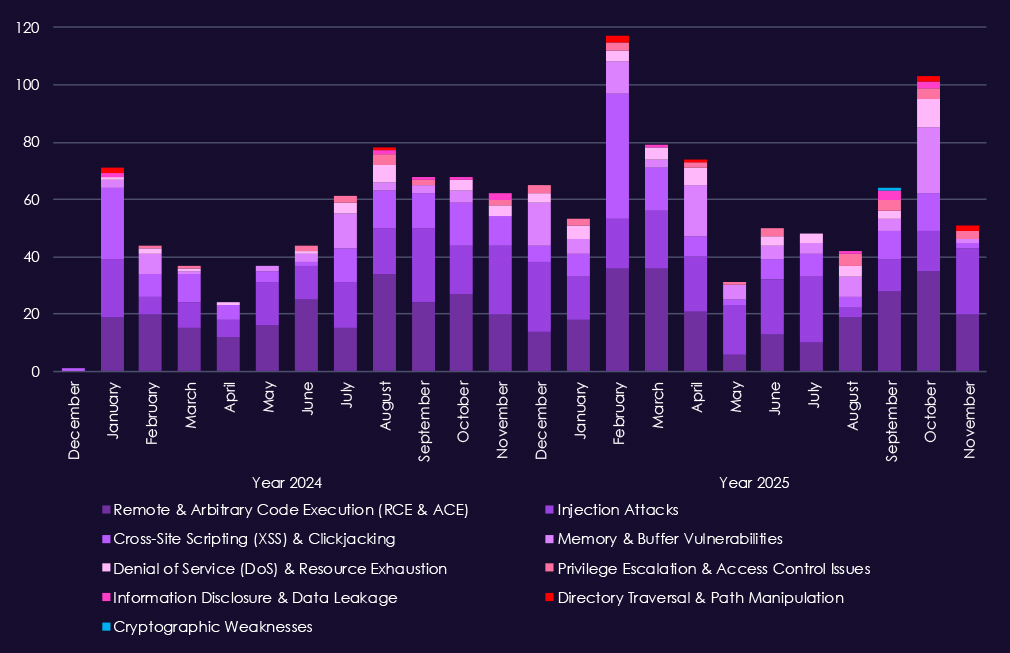
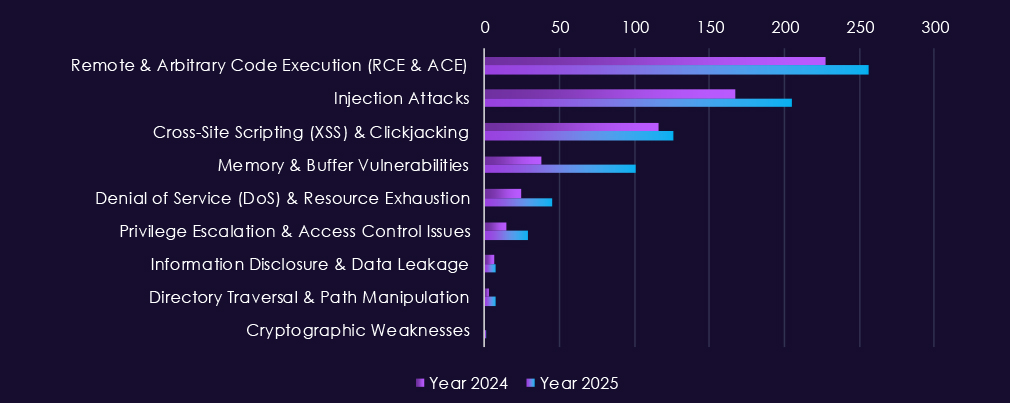
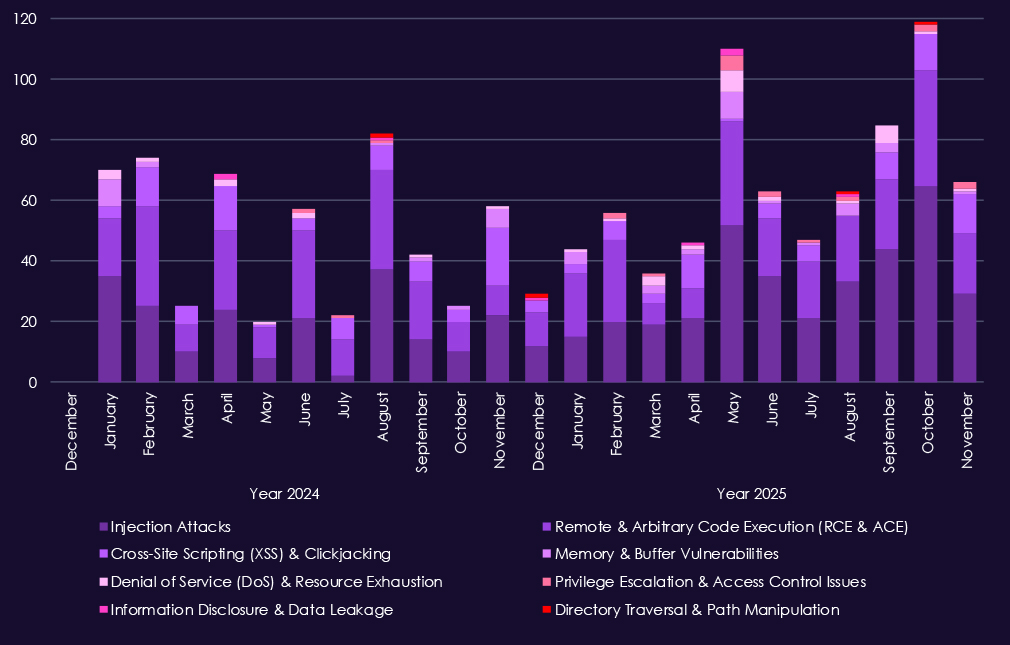
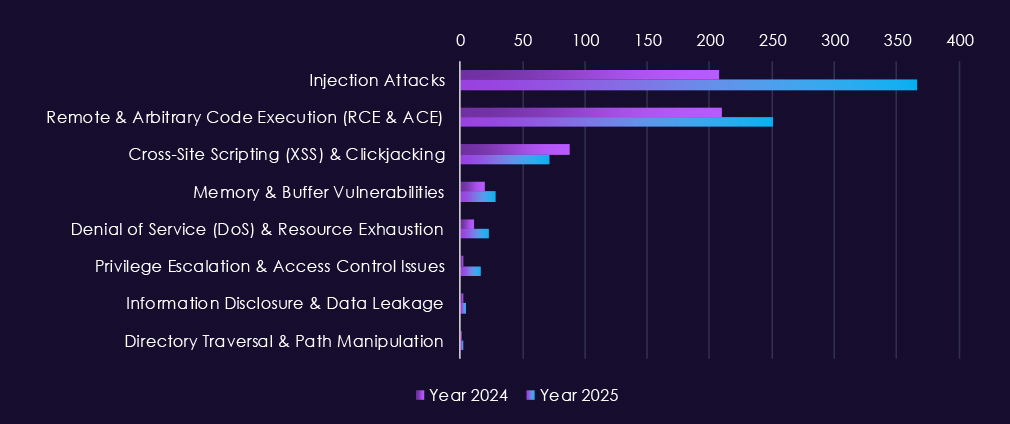
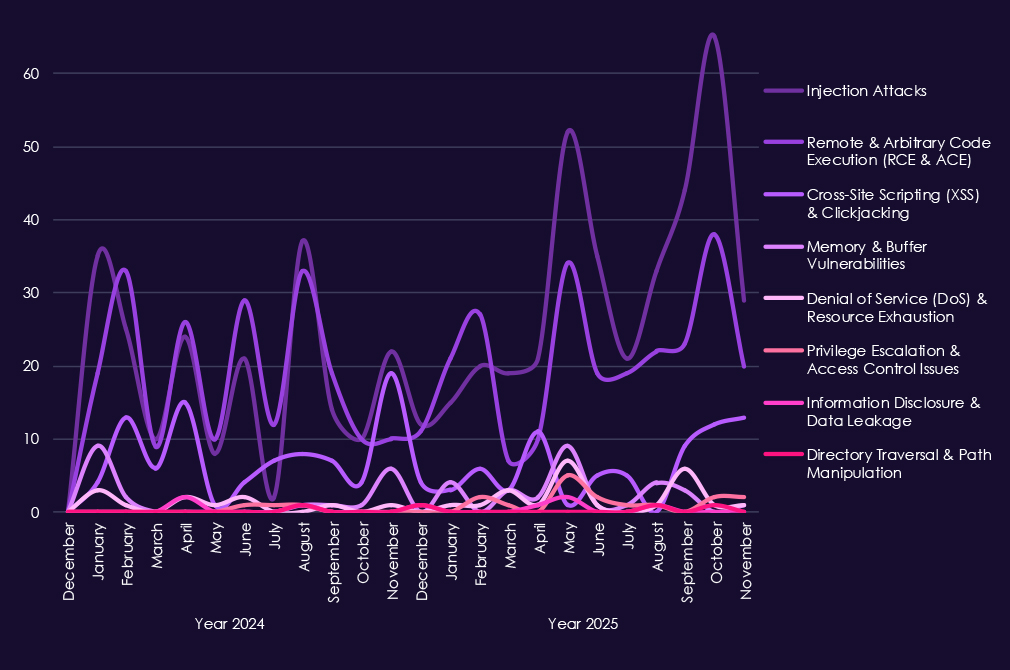
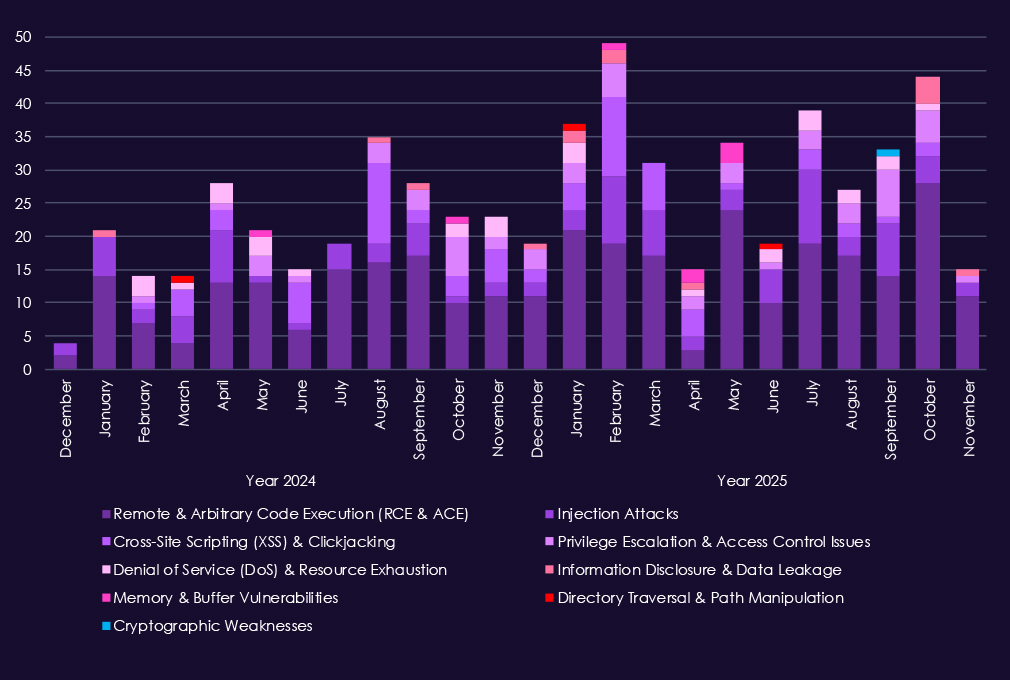
Over the past 23 months, CYFIRMA’s telemetry has identified 2,244 telecommunications & media industry-linked mentions. This is from over 90k CVEs reported and updated in the same time period.
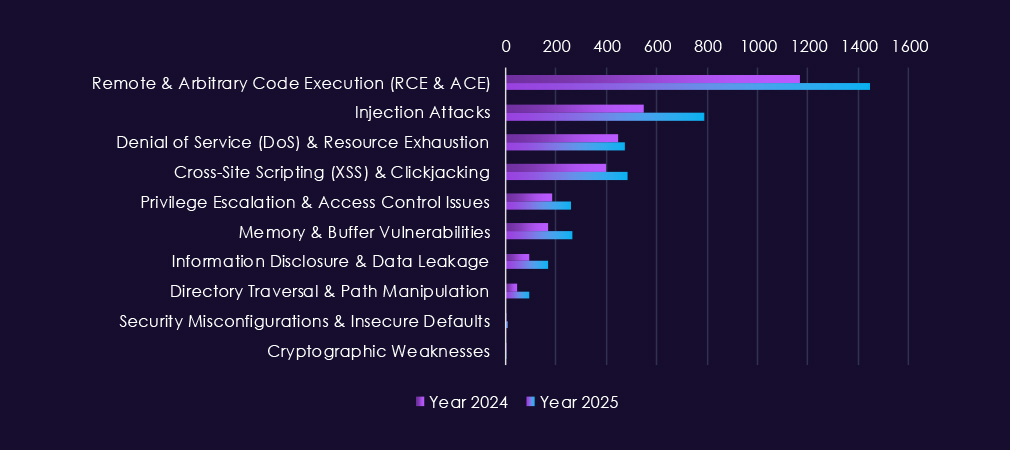
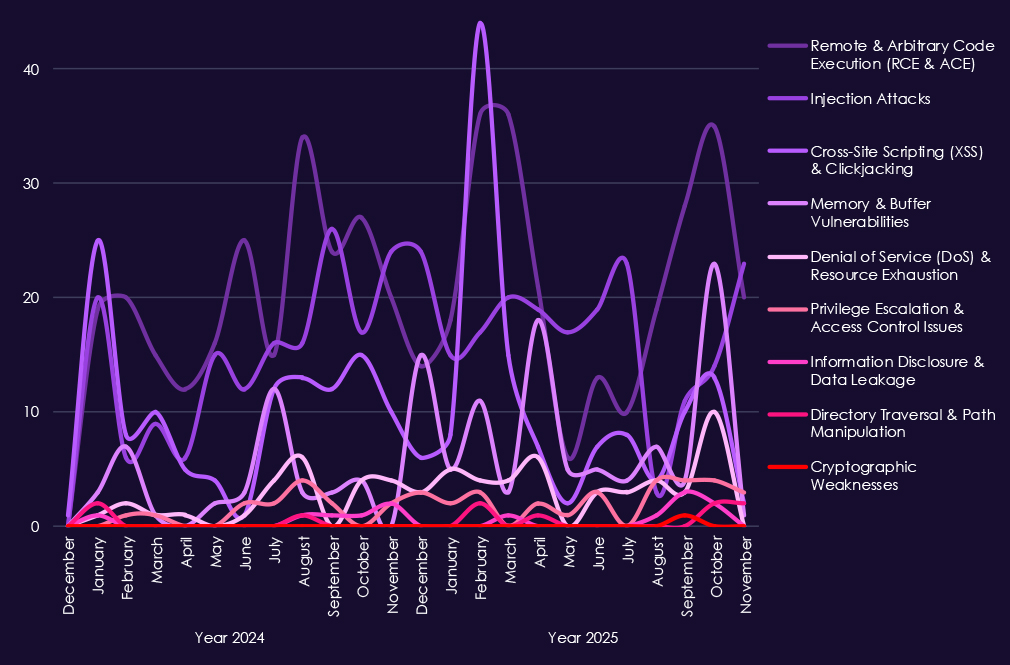
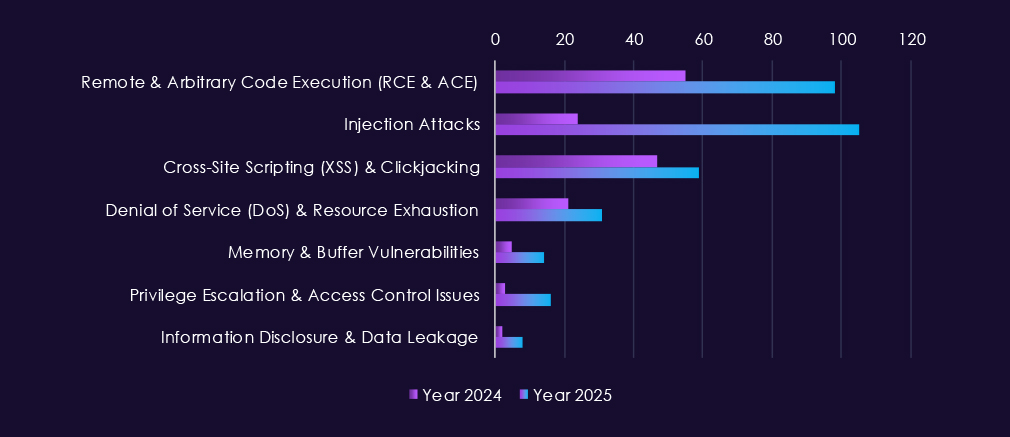
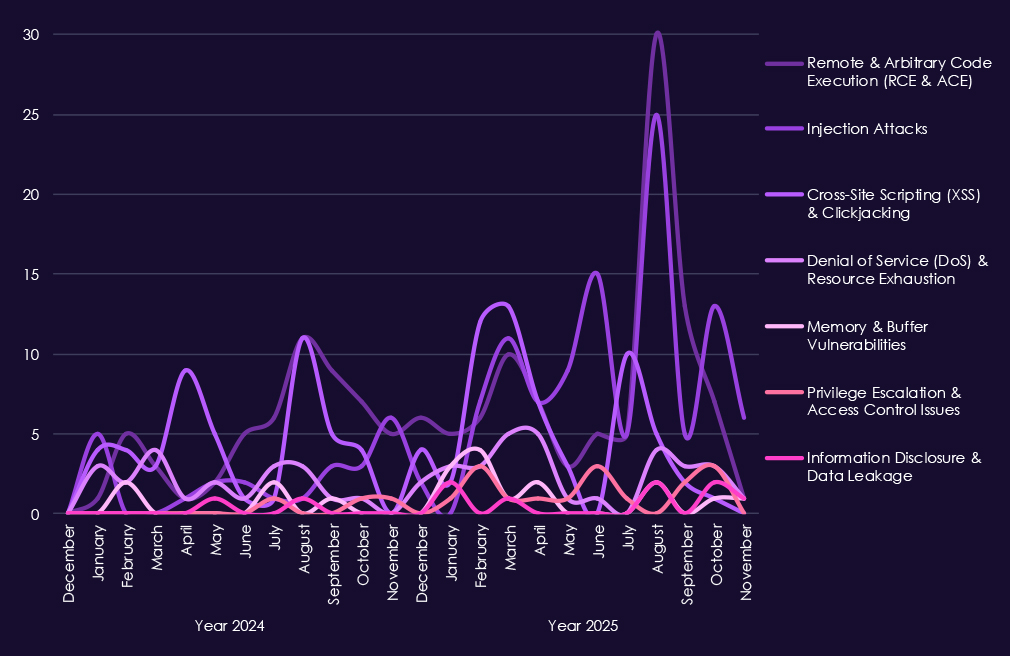
The chart above shows total counts of industry-linked mentions for telecommunications & media technology and individual categories of reported vulnerabilities.The chart below shows year-over-year growth for each category in this industry.
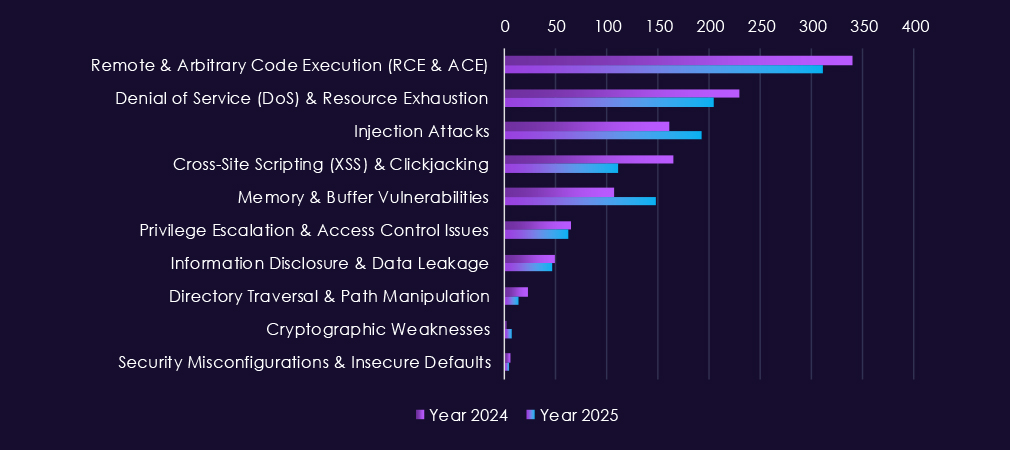
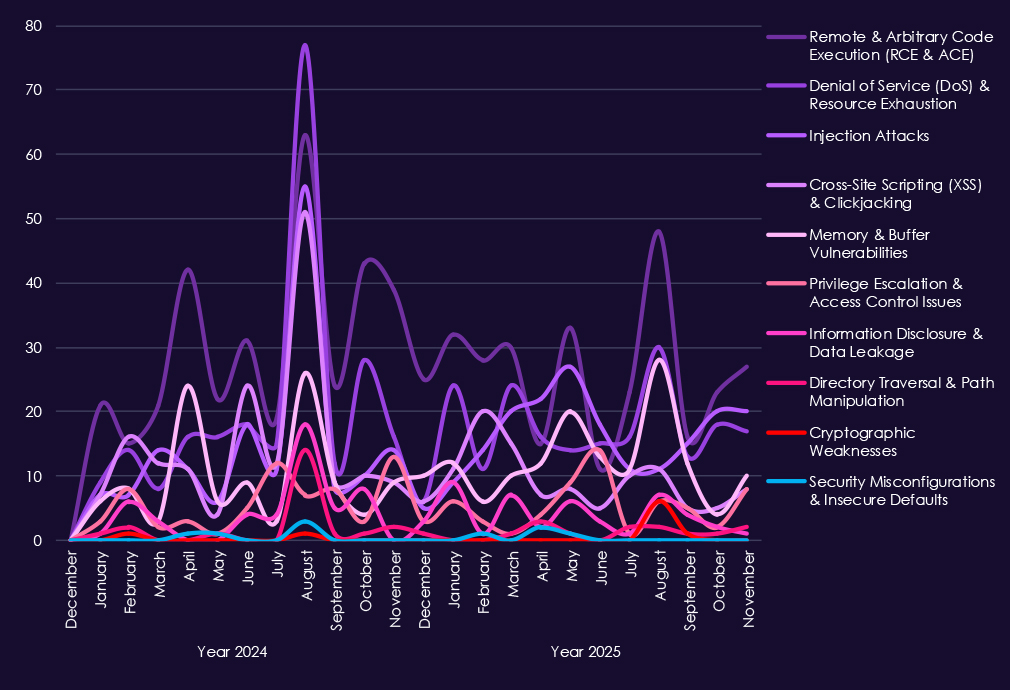
Reported vulnerabilities affecting the telecommunications & media sector show sustained exposure across multiple high-impact flaw classes, with 2025 maintaining consistently high reporting volumes rather than short-lived spikes. Remote and arbitrary code execution (RCE/ACE) vulnerabilities remain the most significant category, appearing steadily throughout the year and underscoring ongoing risk of direct system compromise across carrier, media, and supporting IT platforms.
Denial-of-service and resource exhaustion issues continue to surface regularly, reflecting the sector’s sensitivity to availability disruption and the prevalence of internet-facing infrastructure. Injection attacks and XSS-related flaws remain common, indicating persistent weaknesses in web-based and application-layer systems used for customer management, content delivery, and internal operations. At the same time, memory and buffer vulnerabilities show repeated appearances, pointing to deeper technical issues that can support post-compromise activity and vulnerability chaining.
Lower but steady reporting of privilege escalation, information disclosure, and directory traversal issues highlights continued risk once attackers gain an initial foothold.
Overall, the 2025 vulnerability profile reflects broad, ongoing exposure to exploit-ready vulnerabilities, aligning with the sector’s attractiveness for both espionage-driven access and large-scale cybercrime operations.
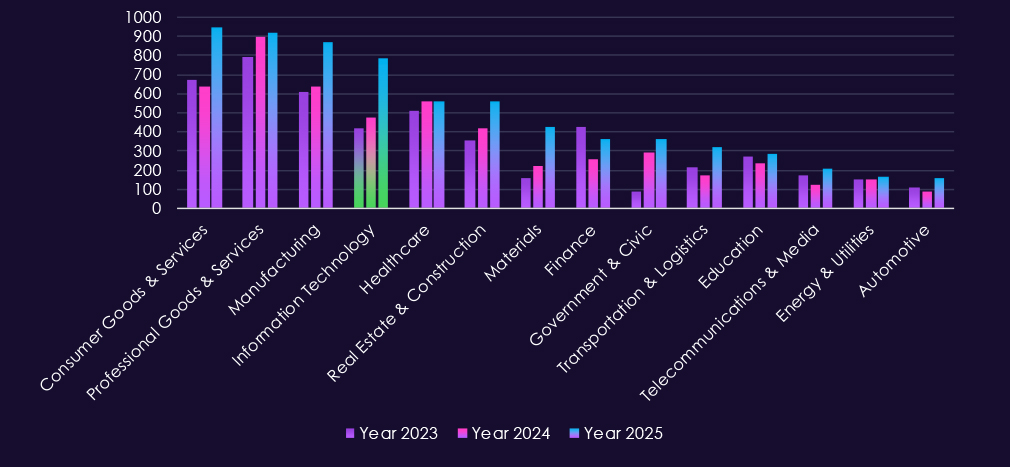
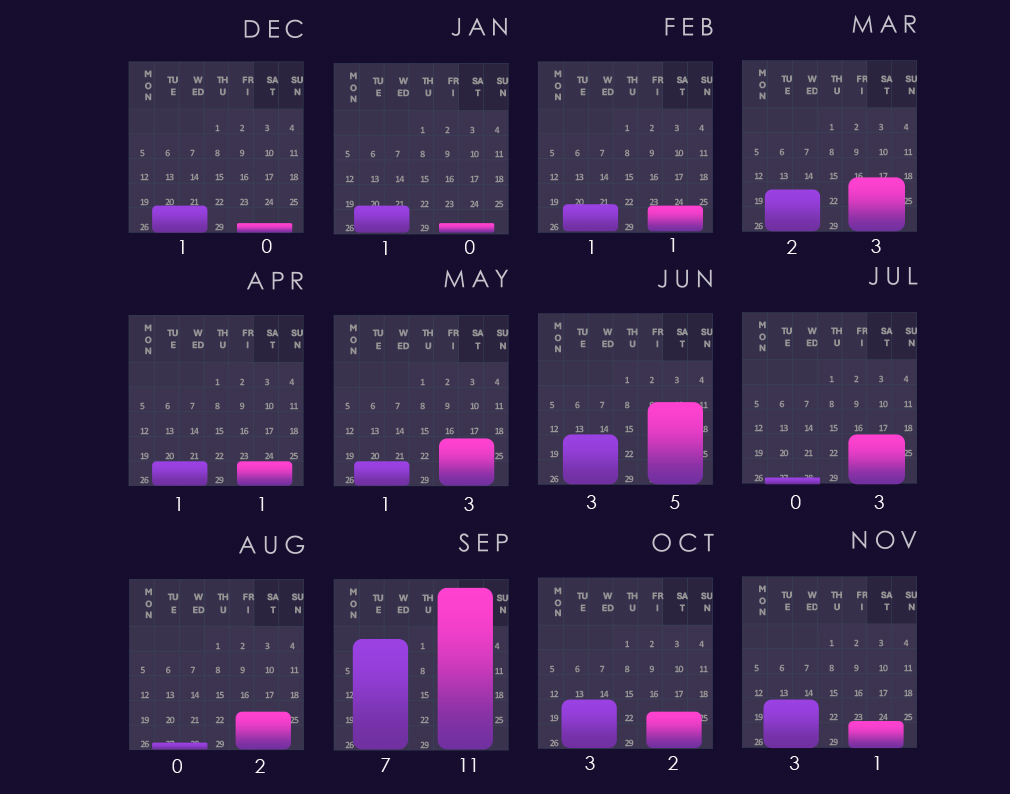
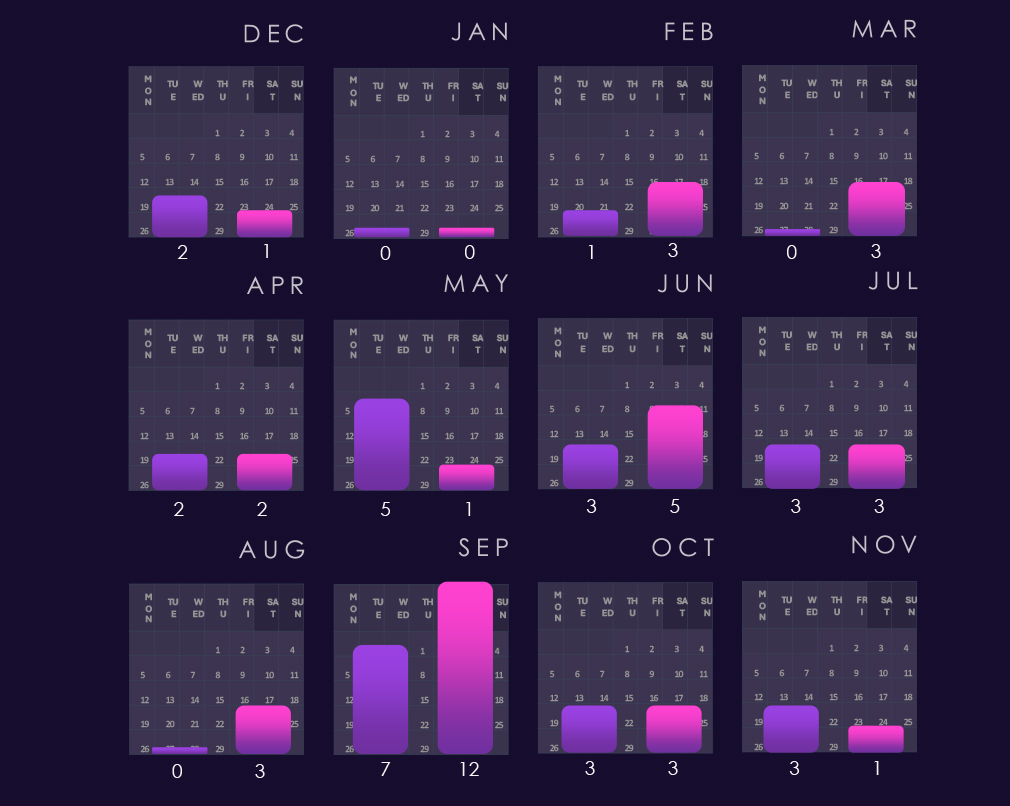
In the past year, CYFIRMA has identified 205 verified victims of ransomware in the telecommunications & media industries. This represents a 64% increase compared to the previous year, which had 125 victims. A notable rebound surpassing 175 victims from 2023.
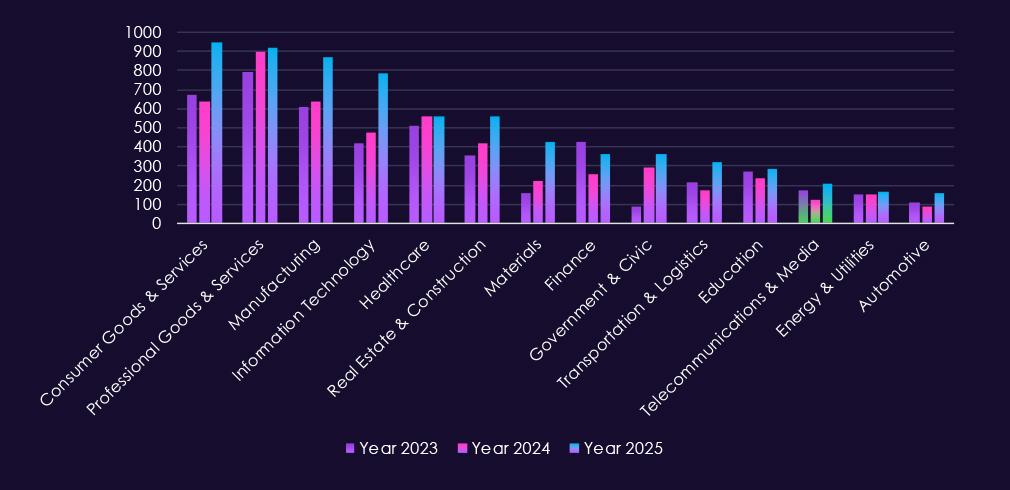
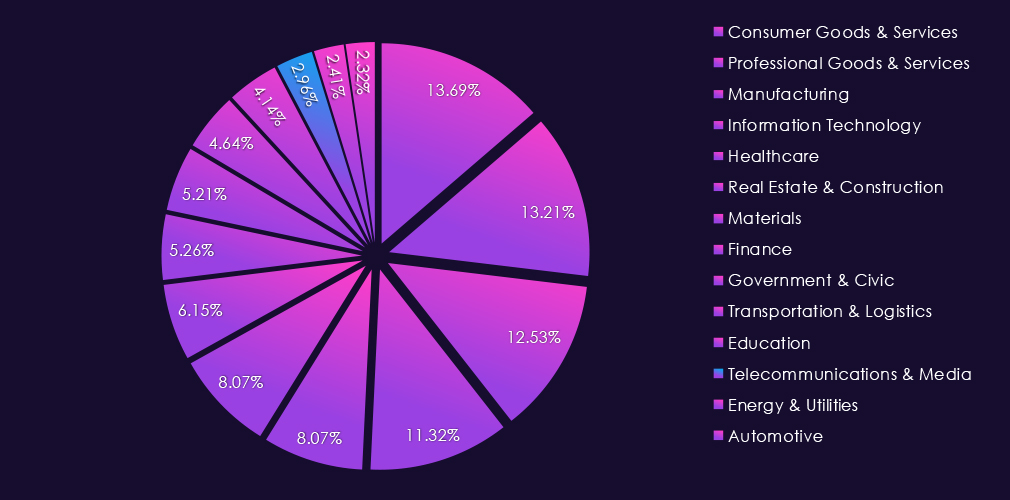
The industry accounts for 2.96% of the overall total of 7,099 ransomware victims during the same period. That is a mild increase from 2.39% in the previous year, but still lower than 3.04% during 2023.
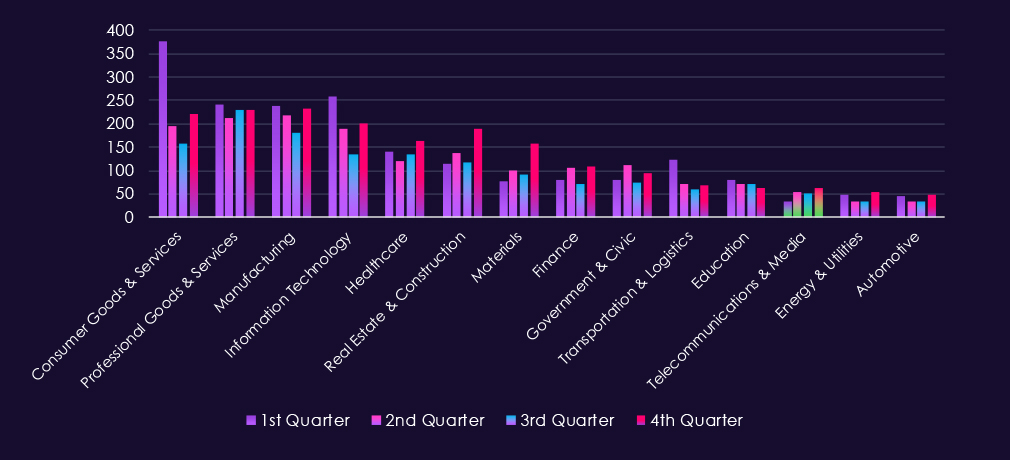
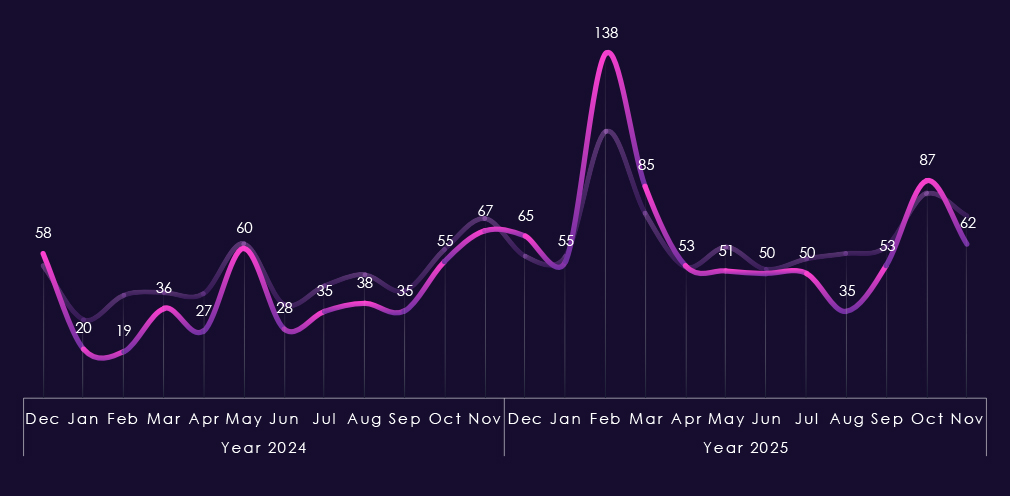
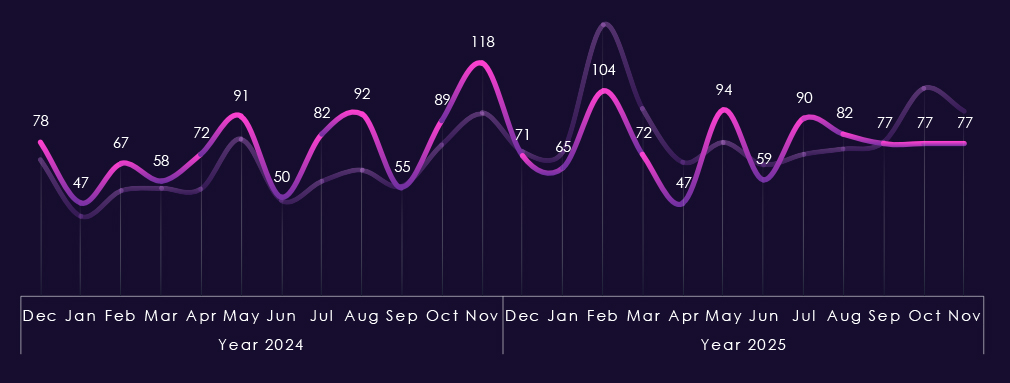
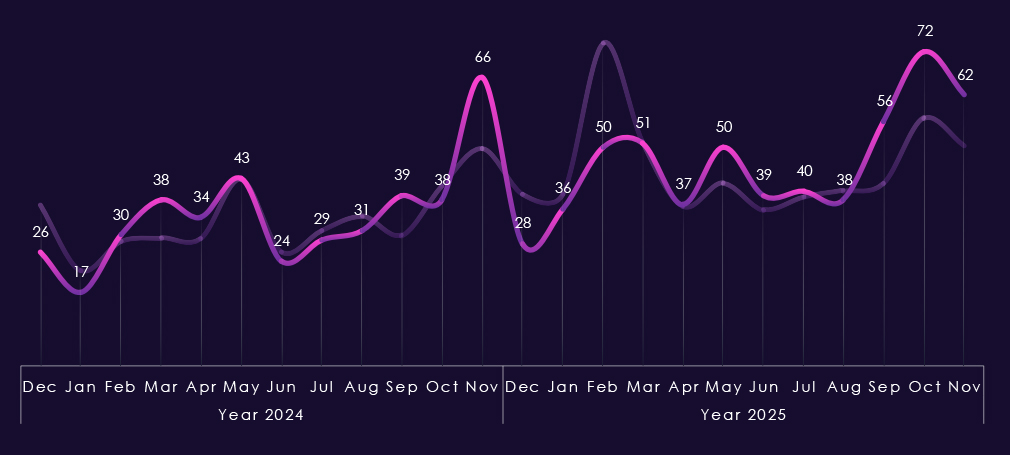
The above bar chart is focused only on 2025 and victim counts per quarter for clear and easy-to-see trends. Telecommunications & media experienced a low victim count in Q1, however, jumped up in Q2 and sustained a higher number into Q3 and grew further in Q4.
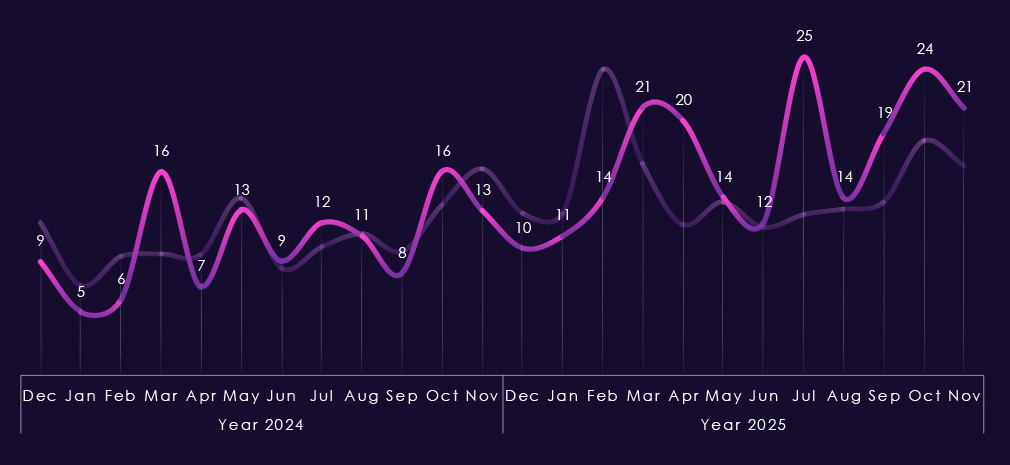
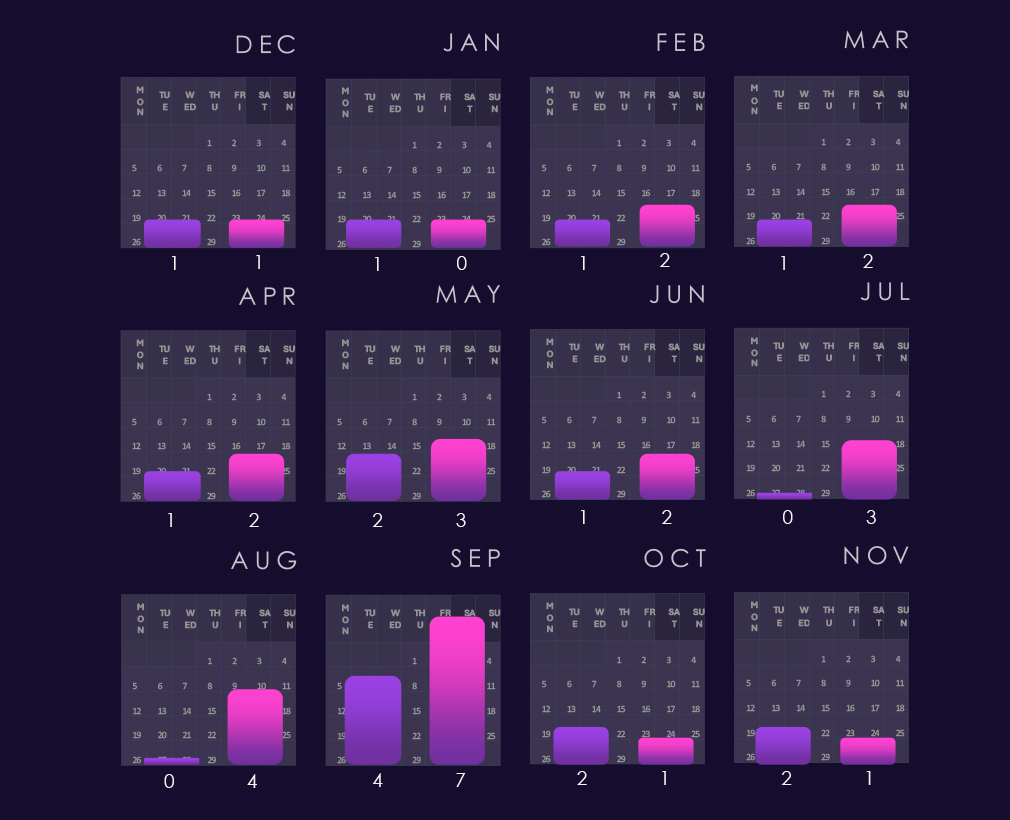
Monthly activity, charted against scaled-down global all-industry victim counts, remains largely in line with the overall ransomware trend in 2024. The only notable divergence is a spike in March 2024. In 2025, the industry avoided the February spike but experienced increased activity in March and April, followed by an even larger surge in July. End-of-year activity also sits above the global trendline, indicating an elevated trajectory into 2026.
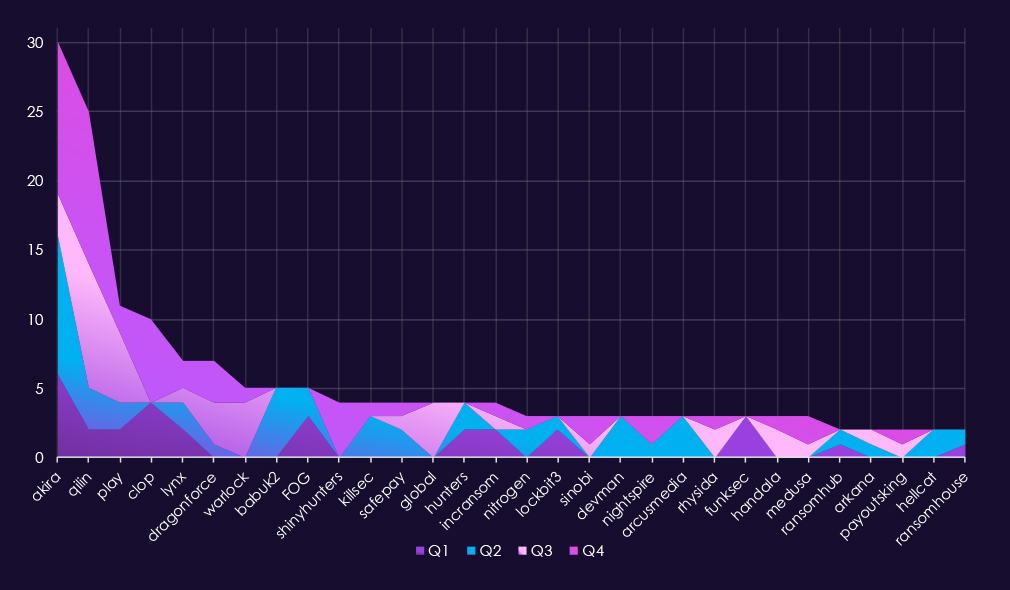
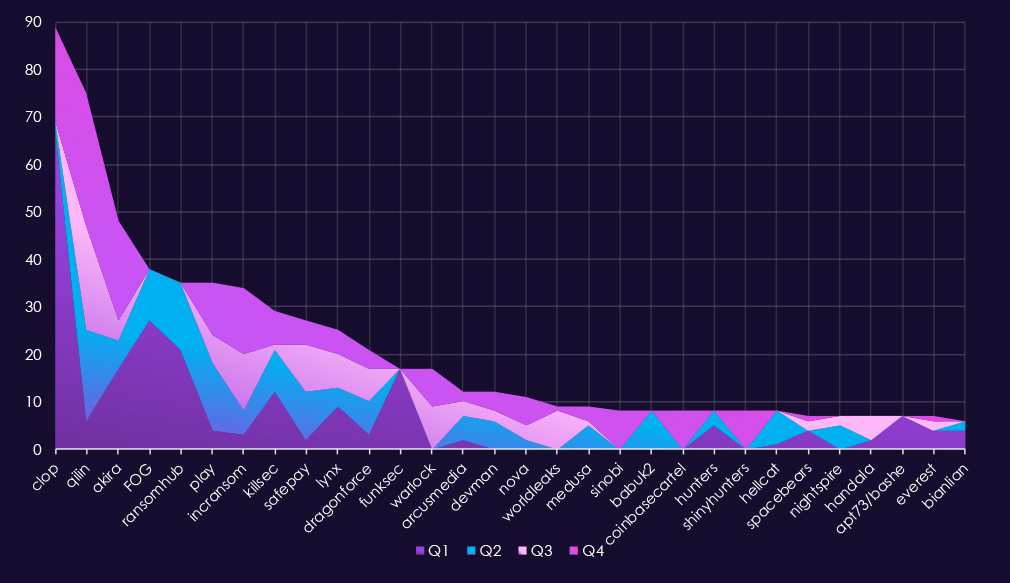
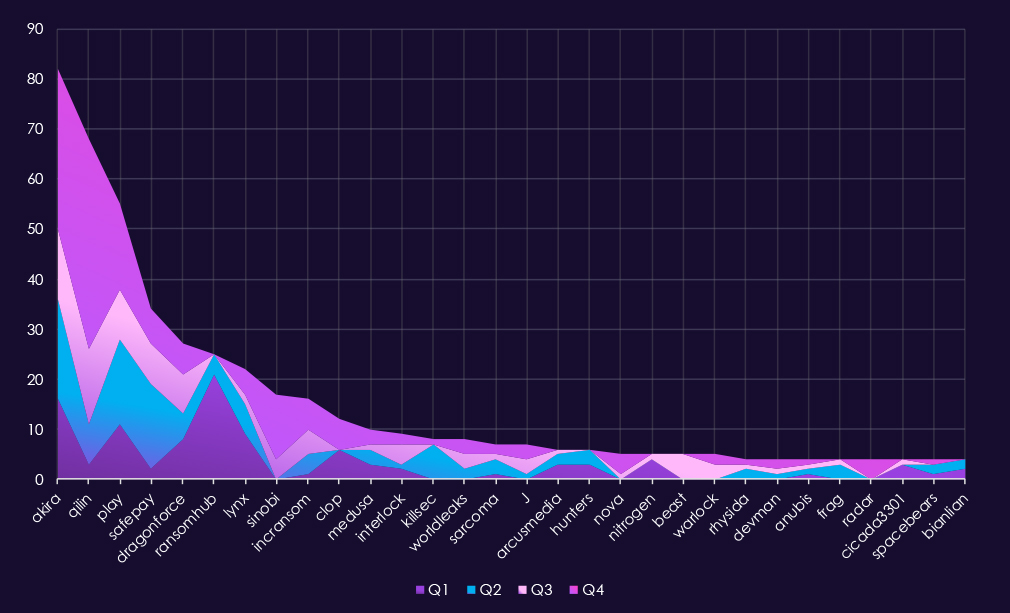
In total 62 out of 124 gangs recorded victims in telecommunications & media industry, exactly 50% participation.A review of quarterly top 30 ransomware gangs’ activity against the telecommunications and media sector in 2025 shows relatively low but steady pressure, with shifts from leading actors and increased dispersion in the second half of the year.
Q1 activity was limited and distributed. Akira (6) led the quarter, followed by Clop (4) and FOG (3). Most other gangs recorded one to two incidents, indicating opportunistic targeting rather than focused targeting.
In Q2, activity increased modestly and became slightly more concentrated. Akira (10) remained the most active gang, while Babuk2 (5) emerged briefly. Several groups, including KillSec, DevMan, and ArcusMedia, appeared only during this quarter, suggesting short-lived activity.
Q3 showed a shift in leadership. Qilin (9) became the most active gang, followed by Play (5) and Warlock (4). Additional one-off appearances from groups such as Global and Handala contributed to a broader but still low-volume threat landscape.
By Q4, activity remained moderate but more evenly distributed. Akira (11) and Qilin (11) jointly led the quarter, while Clop (6) re-emerged after minimal activity in this industry earlier in the year. Several gangs, including ShinyHunters (4) and DragonForce (3), showed late-year activity.
Overall, the telecommunications & media sector experienced low ransomware volumes relative to other industries in 2025, with no sustained dominance by a single actor. Activity patterns suggest largely opportunistic targeting, punctuated by brief surges from individual gangs rather than signs of long-term focused targeting.
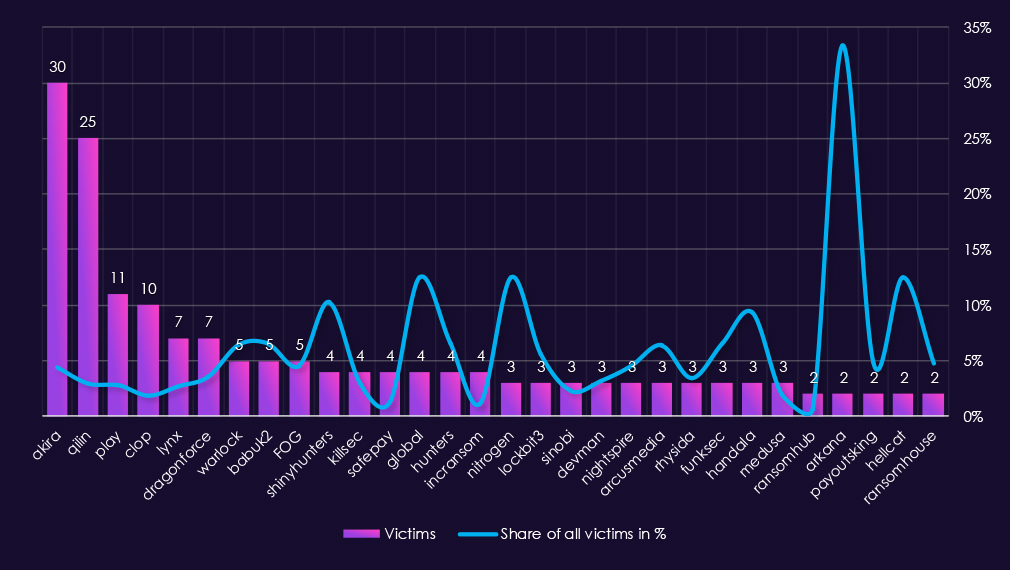
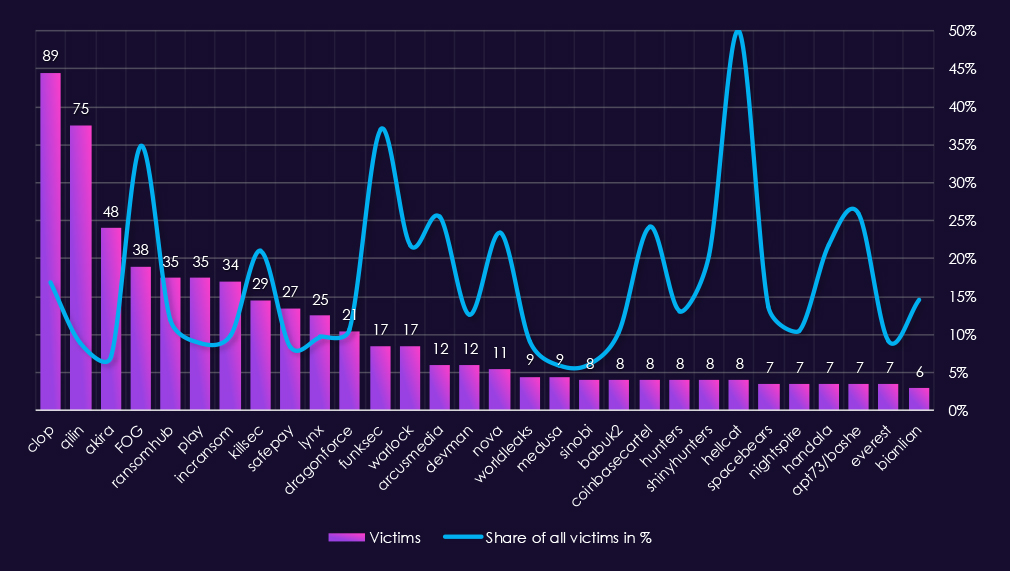
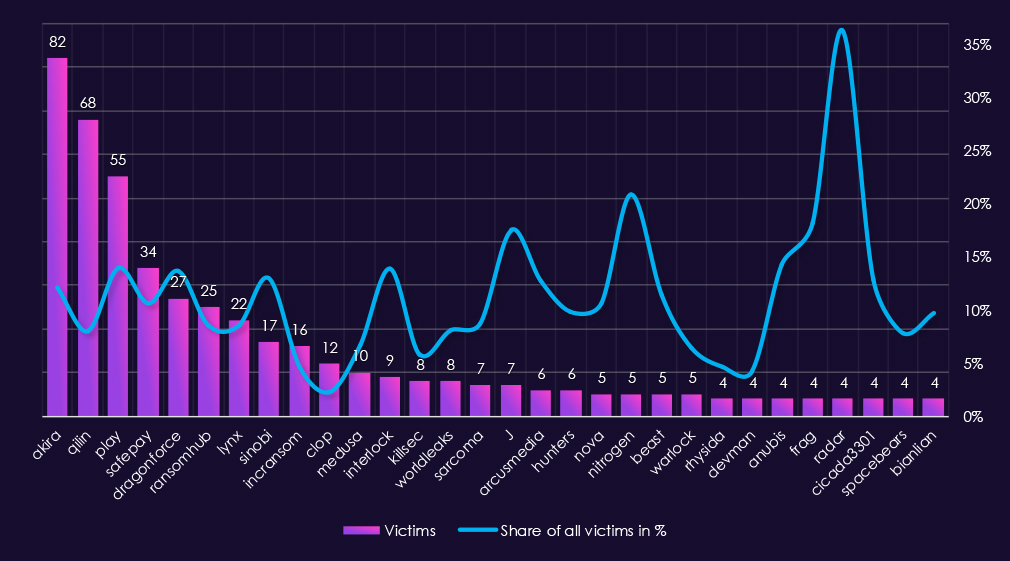
Reviewing 2025 telecommunications & media victim counts alongside each of the top 30 gangs’ share of total victims shows generally low sector specialization, with a small number of proportional outliers skewed by lower victims count.
By sector victim count, Akira (30) and Qilin (25) were the most active gangs. However, telecommunications & media account for only 4.5% and 3.0% of their respective total victims, indicating broad targeting rather than sustained sector focus. Play (11 victims, 2.8%) and Clop (10 victims, 1.9%) show similar patterns.
Only a few gangs show relatively high proportional exposure (>10%). ShinyHunters (10.3%), Global (12.5%), Nitrogen (12.5%), and Hellcat (12.5%) fall into this category. These figures suggest elevated sector exposure, but all are based on four or fewer victims, making them sensitive to small changes in activity.
Several extreme percentage values are driven by very low overall victim counts. Arkana (33.3%) is the most pronounced example, reflecting two telecommunications & media victims out of a small total set. Similar skew is visible for Handala (9.4%), ArcusMedia (6.4%), and FunkSec (6.5%), where limited volume inflates apparent focus.
Most gangs fall into a low focus range (<5%), including DragonForce, KillSec, SafePay, IncRansom, Medusa, and RansomHub, indicating telecommunications and media was generally a secondary or opportunistic target.
Overall, telecommunications and media does not appear to be a prioritized sector for most ransomware gangs in 2025. High percentage values are largely the result of small sample sizes rather than sustained or deliberate sector targeting.
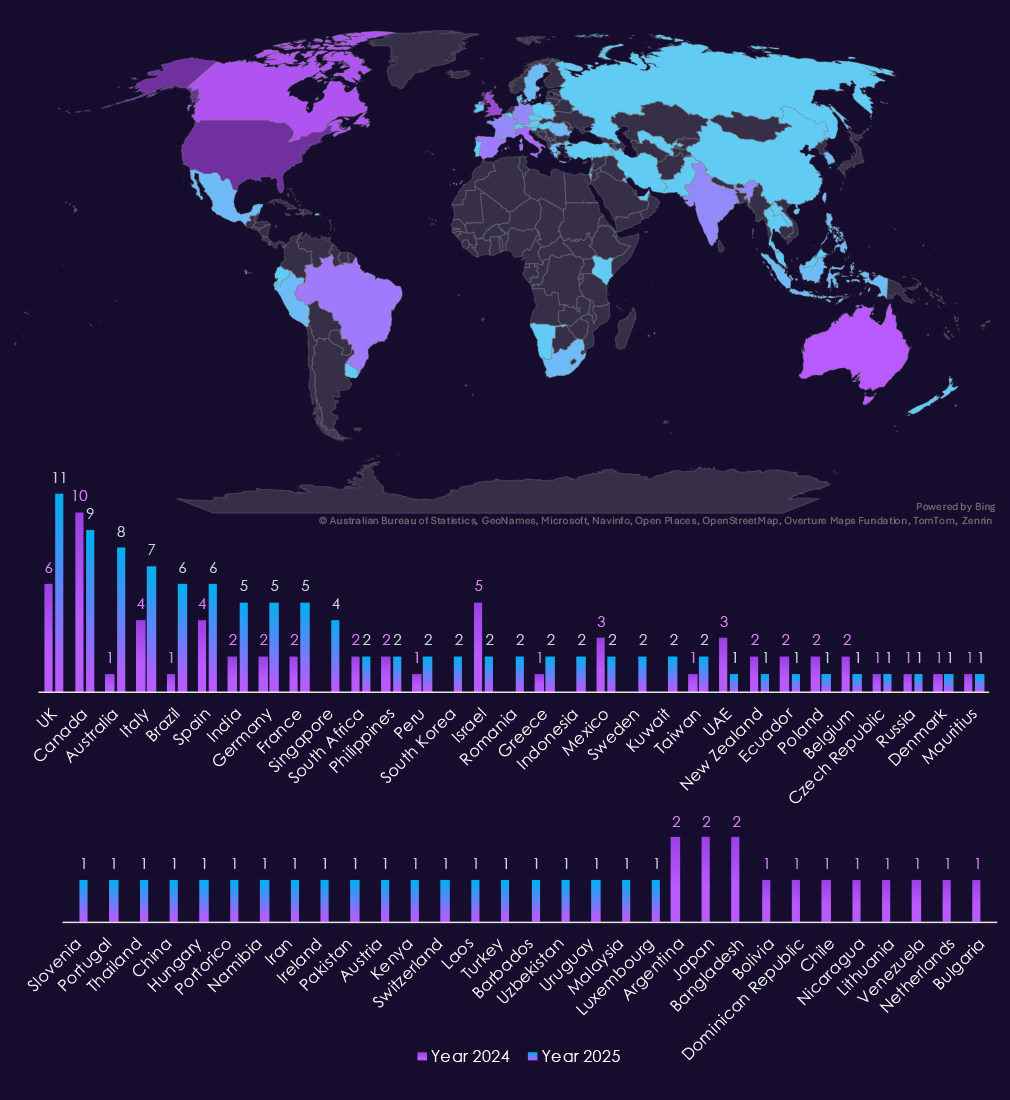
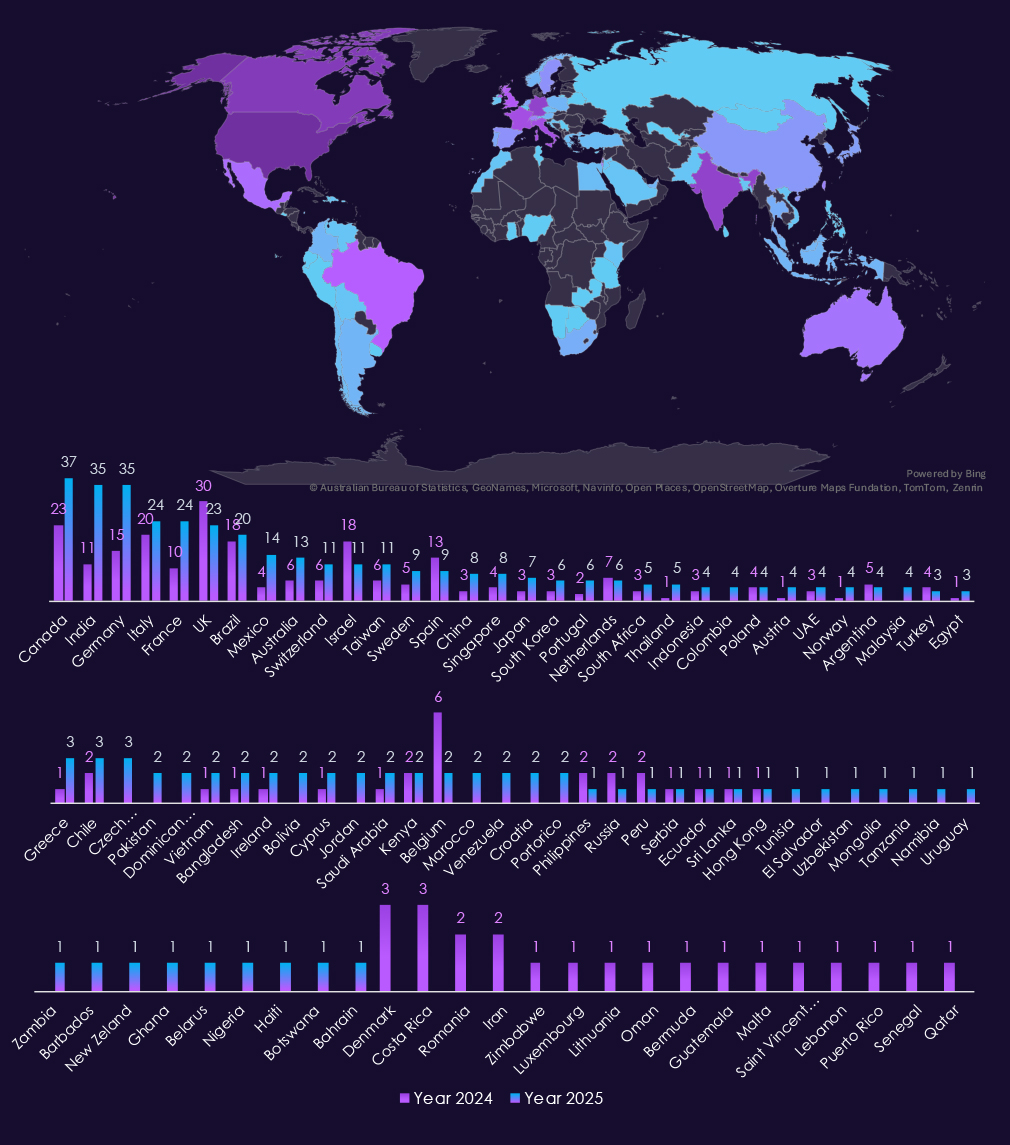
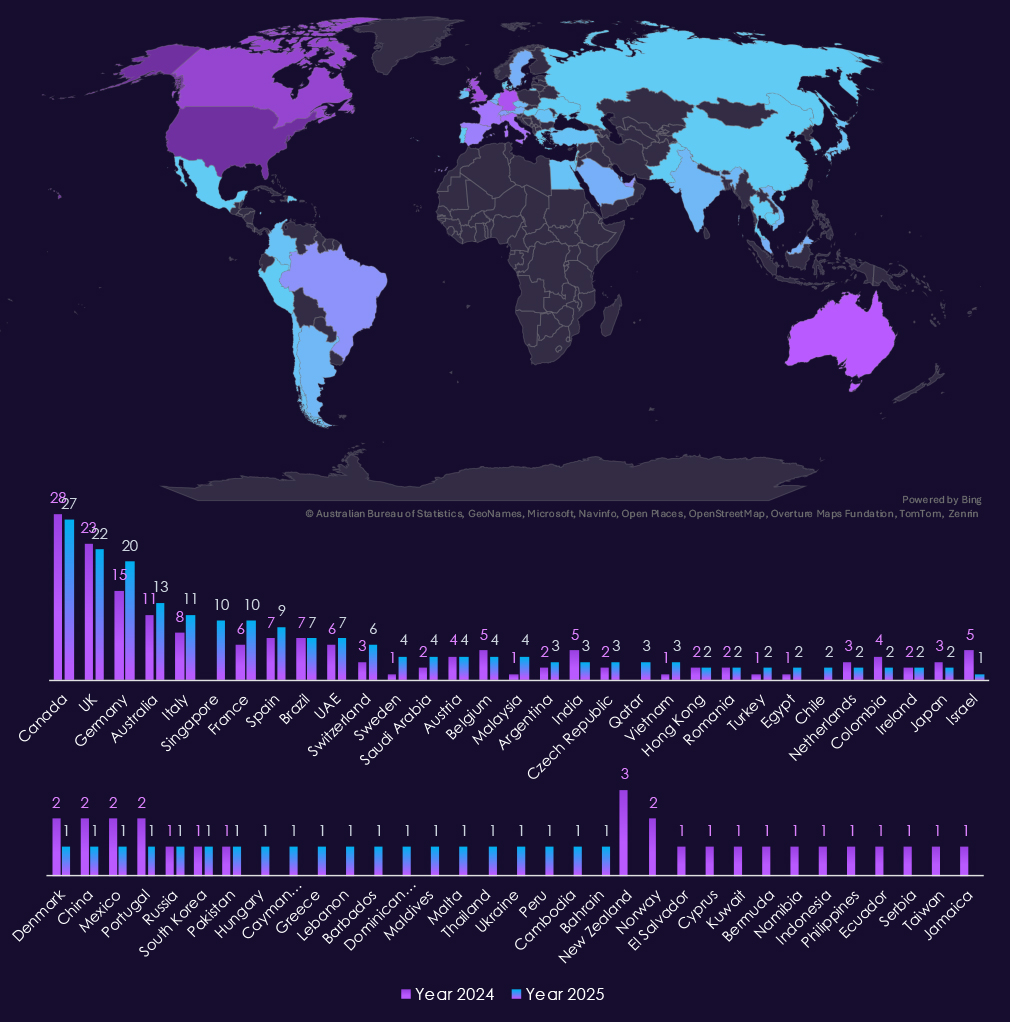
With 85 victims, the USA accounts for 41% of telecommunications & media industry victims in 2025. The US also recorded a major increase from 49 victims in 2024.
Australia, Brazil, and Singapore are among the countries with the highest increases year-over-year. The UK, Italy, India, Germany, and France further recorded near or more than double the number of victims.
A total of 52 countries recorded victims in 2025, a notable increase from 37 in 2024.
Year-over-Year Risk Elevation: Moderate

In 2025, the telecommunications & media sector experienced a major year-over-year escalation in APT exposure, with victims observed in 65% of tracked campaigns, up sharply from 2024. Activity reflected a dense mix of nation-state and financially motivated actors, underscoring the sector’s role as critical communications infrastructure, an intelligence collection platform, and a downstream access vector into other industries. Targeting was globally distributed, with sustained focus on advanced economies and rapidly expanding regional infrastructure markets.
Attack activity continued to originate primarily from web applications, reflecting widespread exposure across customer portals, content platforms, advertising systems, and operational support environments. Compared to 2024, 2025 showed a pronounced increase in operating system targeting, alongside expansion into application servers, databases, cloud services, and network infrastructure. This progression indicates a shift toward persistence, lateral movement, and network-level visibility, consistent with both espionage-driven access and mature cybercrime operations.
Underground and dark web chatter remained extremely high throughout 2025, dominated by data breaches, data leaks, and ransomware-related discussions. Ransomware chatter showed volatile but elevated patterns, while mentions of claimed hacks and web exploits increased significantly, suggesting active advertising and resale of access. DDoS and hacktivism activity remained visible but episodic, appearing primarily as short-lived surges layered on top of broader criminal and intelligence-driven activity.
Ransomware victimization increased 64% year over year, though the sector’s overall share of global ransomware victims remained moderate. Activity was distributed across many actors, with limited evidence of sustained sector specialization and most incidents reflecting opportunistic targeting. Geographic exposure widened substantially in 2025, with more countries affected and the United States accounting for the largest share of victims, reinforcing telecommunications & media as a highly exposed but primarily opportunistic ransomware target entering 2026.
Over the past 12 months, the information technology industry recorded victims across 22 of the 43 Advanced Persistent Threat (APT) campaigns observed – a presence in 51% of the campaigns. It is a minor decline from 26 in the previous year.
These victims spanned multiple segments within the industry as shown below:

The IT industry remains a central target for both nation-state and financially motivated threat actors, as an access multiplier into other industries. In 2025, activity is led by China-aligned groups such as Volt Typhoon, Salt Typhoon, Stone Panda, MISSION2025, Mustang Panda, APT27, and Emissary Panda.
At the same time, financially motivated actors including FIN7, FIN11, and TA505 remain active, reflecting continued ransomware, credential theft, and access-broker activity. Lazarus Group remains consistent with its historical targeting of technology firms.
Additional activity from Russia- and Iran-linked actors such as Gamaredon, Cozy Bear, Fancy Bear, and Fox Kitten underscores the sector’s intelligence value. The expanded presence of newly tracked CC- and NS-prefixed clusters points to a wider set of regional actors actively targeting the IT industry. There is sustained interest in IT service providers, software vendors, and platform operators that can enable downstream access, supply-chain compromise, or long-term surveillance.
Victims in IT–focused APT campaigns are concentrated in globally connected technology hubs and major service-provider markets. In 2025, the most frequently affected countries include Japan, United States, United Kingdom, Australia, India, South Korea, Taiwan, and Thailand. These locations host dense concentrations of software vendors, cloud and managed service providers, and regional IT hubs.
Sustained victim reporting across Southeast Asia and the Asia-Pacific following regional growth in IT services and outsourcing. Additional activity across Europe and the Middle East reinforces a globally distributed targeting pattern, consistent with campaigns that follow shared platforms, vendors, and cross-border service relationships rather than focusing on a narrow set of countries.
Attacks against the information technology sector continue to concentrate on highly exposed and widely trusted technologies, with web applications remaining the primary entry point in both 2024 and 2025. Their dominance reflects the central role of web-based platforms in software delivery, customer management, and service administration, making them a consistent target for credential theft and initial access.
In 2025, there is a noticeable increase in operating system targeting, indicating greater emphasis on persistence, lateral movement, and control once access is achieved. Activity also extends into database platforms, application infrastructure, and network monitoring tools, suggesting attempts to access sensitive customer data, source code, or internal telemetry. Continued targeting of routers and VPN solutions, alongside cloud infrastructure services and software asset management tools, highlights interest in trusted access paths and control planes rather than purely perimeter-facing systems.
Overall, the technology observed points to campaigns that move quickly from exposed services into core IT management and infrastructure layers, consistent with both espionage-driven operations and mature cybercrime activity seeking persistent, high-value access within IT environments.
Over the past 23 months, CYFIRMA’s telemetry has identified 96,647 information technology industry-linked mentions. This is from total of 2.5 million posts across various underground and dark web channels and forums.
The chart above shows total counts of industry-linked mentions for the IT industry and individual categories of context for the mentionsThe chart below shows year-over-year growth for each category in this industry.
Underground & dark web chatter tied to the information technology sectors remains extremely high due to its essential nature to cyberspace and continues to intensify into 2025, reflecting both sustained attack activity and frequent public disclosure of incidents. Data breaches and data leaks dominate discussion by a wide margin, with consistently elevated volumes month to month, indicating ongoing exposure of customer data, source code, credentials, and internal systems rather than isolated events.
Ransomware-related chatter shows sharp escalation, spiking repeatedly in 2025 after already elevated levels in late 2024. This aligns with continued pressure on IT providers, software vendors, and managed service firms, where compromise can expose clients. Mentions of claimed hacks and web exploits also increase significantly, suggesting active advertising of access, vulnerability exploitation, and credential abuse targeting widely used platforms.
DDoS and hacktivism activity is present but uneven, appearing in bursts tied to short-lived campaigns.
Overall, the 2025 chatter profile reflects persistent, high-volume activity centered on data exposure, ransomware, and exploit-driven access, consistent with the IT sector’s role as both a direct target and a gateway to managed client environments.
Over the past 23 months, CYFIRMA’s telemetry has identified 7,050 IT industry-linked mentions. This is from over 90k CVEs reported and updated in the same time period.
The chart above shows total counts of industry-linked mentions for information technology and individual categories of reported vulnerabilities.The chart below shows year-over-year growth for each category in this industry.
Reported vulnerabilities in the information technology are consistently the highest of any industry, reflecting the fact that IT products, platforms, and services form the foundation of most modern environments and therefore account for the largest share of disclosed CVEs overall. This structural reality explains the sustained and high monthly volumes seen across both 2024 and 2025.
Within that baseline, remote and arbitrary code execution (RCE/ACE) vulnerabilities dominate, appearing in very high numbers throughout 2025 and representing the most direct risk of system takeover across software, cloud platforms, and managed services. Injection attacks and XSS-related flaws remain widespread, highlighting persistent weaknesses in web frameworks and application logic that are heavily reused across the IT ecosystem.
Denial-of-service issues continue to surface regularly, reflecting the exposure of internet-facing infrastructure and shared services. At the same time, privilege escalation and memory-related vulnerabilities show steady presence, indicating ongoing risk once attackers gain an initial foothold and seek deeper control or lateral movement. Lower but consistent reporting of information disclosure, directory traversal, and configuration-related issues further reinforces the breadth of the attack surface.
Overall, the 2025 CVE profile for IT reflects volume driven by scale and combined with the sector’s role as both a direct target and a multiplier of risk across all other industries.
In the past 12 months, CYFIRMA has identified 784 verified IT industry ransomware victims. 64% increase from 478 victims in previous year, which recorded only minor increase from 421 victims in 2023. IT recorded third highest increase year-over-year as attackers started exploiting stolen data to attack clients of many IT vendors.
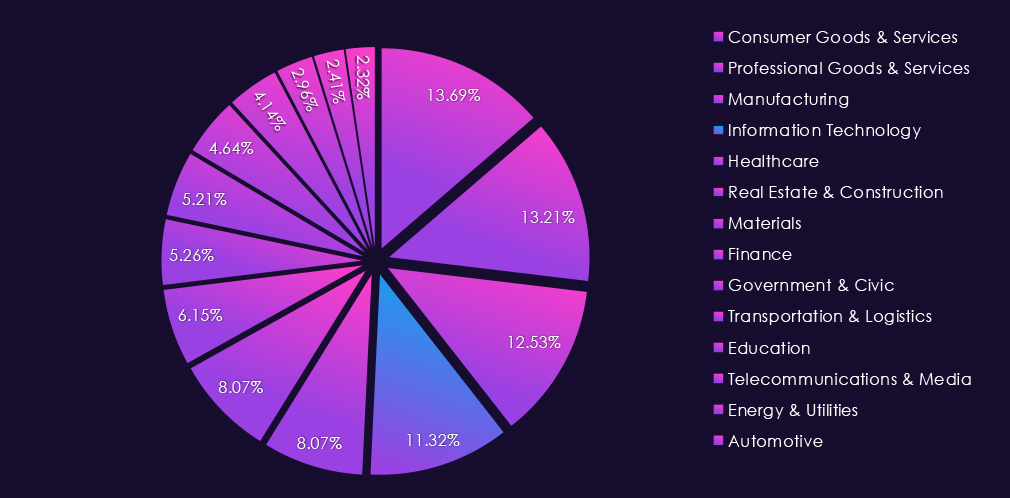
The IT industry accounts for 11.32% of the overall total of 7,099 ransomware victims during the same period. That is a significant increase from 9.16% in the previous year, and an even further increase from 8.41% in 2023, truly highlighting the increased focus on this industry by ransomware.
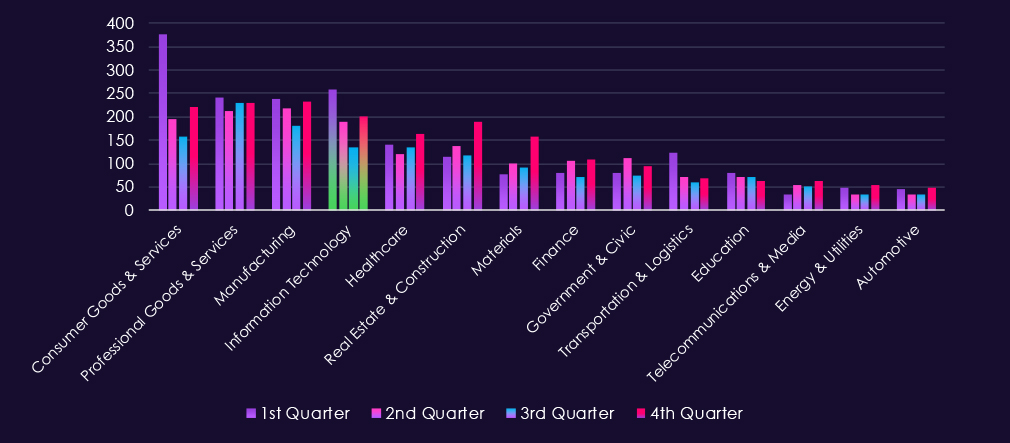
Bar chart above is focused only on 2025 and victims counts per quarter for clear and easy-to-see trends. Q1 was the worst for the IT industry by a lot. Fortunately, there was a significant decline through Q2 into the lowest activity during Q3; however, the victims count rebounded in Q4.
Monthly activity charted over scaled-down global all industries victims counts shows 2024 activity consistent with, yet below, the global trendline. During 2025, the pattern is similar, but February and March spikes were more felt by the IT industry. August recorded a notable dip compared to global activity, but from September onwards, activity caught up again.
In total, 93 out of 124 gangs recorded victims in the IT industry. A remarkably high 75% participation.A review of quarterly top 30 ransomware gangs’ activity against the information technology sector in 2025 shows consistently high volume, with pronounced early-year surge and a shift toward different leading actors in the second half.
Q1 activity was dominated by Clop (67), alongside FOG (27) and RansomHub (21). Akira (17) and FunkSec (17) also recorded notable activity. IT was among industries hit hard by Clop exploit driven campaign.
In Q2, overall activity remained elevated but became more diversified. Qilin (19) emerged as the most active gang, followed by RansomHub (14), Play (14), and FOG (11). Several Q1-heavy actors, including Clop and FunkSec, declined sharply.
Q3 marked another shift. Qilin (22) and IncRansom (12) led the quarter, while SafePay (10) and Warlock (9) increased activity. A number of gangs appeared for the first time in Q3, including WorldLeaks (8), contributing to a broader mid-year threat landscape.
By Q4, activity intensified again. Qilin (28) was the most active gang, followed by Akira (21) and IncRansom (14). Several groups, including Sinobi, CoinbaseCartel, and ShinyHunters (8 each), showed sharp late-year increases, suggesting short-term or opportunistic campaigns.
Overall, the information technology sector experienced high and variable ransomware activity throughout 2025. Leadership shifted between quarters, with Clop dominating early and Qilin emerging as the most persistent actor by year-end, while a long list of gangs contributed compounded elevated volume of activity.
A look at 2025 information technology victim counts alongside top 30 gangs’ share of total victims shows both high absolute exposure and a comparatively large number of gangs with meaningful proportional focus on the sector.
By sector victim count, Clop (89) was the most active gang, with information technology accounting for 17.0% of its total victims. Qilin (75 victims, 8.9%) and Akira (48 victims, 7.1%) also recorded high volumes, but with lower proportional exposure, indicating broad targeting rather than sector focus. RansomHub (35 victims, 12.0%) and Play (35 victims, 8.9%) fall between these two patterns.
Several gangs show high proportional exposure (>10%), including both high- and mid-volume actors. Notable examples include FOG (34.9%), KillSec (21.0%), Warlock (21.8%), DragonForce (10.7%), DevMan (12.6%), and Hunters (13.1%), suggesting information technology industry focus.
A number of extreme percentage values are driven by relatively low total victim counts. Hellcat (50.0%), FunkSec (37.0%), ArcusMedia (25.5%), CoinbaseCartel (24.2%), Nova (23.4%), APT73/Bashe (25.9%), and ShinyHunters (20.5%) each recorded fewer IT-sector victims, meaning small absolute changes inflate their apparent sector focus.
Only a limited subset of gangs fall into a low focus range (<5%), indicating that information technology was frequently targeted across the ransomware ecosystem in 2025. Even actors with modest victim counts often show IT accounting for a notable share of overall activity.
Overall, information technology emerges as a highly attractive sector for ransomware operations, with strong alignment between absolute victim volume and proportional exposure. This shows us sustained and widespread interest rather than isolated or opportunistic targeting.
With 352 victims, the USA accounts for 45% of IT industry victims in 2025. The US also recorded a major increase from 195 victims in 2024.
India, France, Germany, Mexico, and Australia are among the countries with the highest increases year-over-year. Most of the countries on the charts above have recorded an increase or first victims. The UK, Israel, Belgium, and Spain are among the countries with a recorded decline in victims.
A total of 74 countries recorded victims in 2025, an increase from 63 in 2024.
Year-over-Year Risk Elevation: High

In 2025, the information technology sector remained one of the most heavily targeted industries, with victims observed in 51% of tracked APT campaigns, representing a slight year-over-year decline but still reflecting sustained strategic interest. Activity was driven by a broad mix of nation-state and financially motivated actors, reinforcing IT’s role as an access multiplier into other industries through software vendors, service providers, and shared platforms. Targeting followed globally connected technology hubs and service-provider markets rather than isolated geographies.
Attack activity continued to originate primarily from web applications, reflecting their central role in software delivery, customer management, and service administration. Compared to 2024, 2025 showed increased targeting of operating systems and core infrastructure, alongside databases, application platforms, cloud services, and network monitoring tools. This progression indicates campaigns moving rapidly from initial access into persistent control of trusted IT environments, consistent with both espionage-driven operations and mature cybercrime seeking downstream leverage.
Underground and dark web chatter remained high and intensified further into 2025, dominated by data breaches, data leaks, ransomware, and exploit-related discussions. Ransomware chatter escalated sharply, aligning with increased pressure on IT vendors and managed service providers where compromise can cascade into client environments. Mentions of claimed hacks and web exploits also rose significantly, while DDoS and hacktivism appeared intermittently rather than as sustained drivers.
Ransomware victimization increased 64% year over year, with information technology also recording a growing share of all ransomware victims. Activity was high-volume and widely distributed, involving three-quarters of active ransomware gangs, with many showing meaningful proportional exposure to the sector. The United States accounted for the largest share of victims, while geographic exposure expanded further in 2025. The information technology industry, especially various managed services, became a hot target as threat actors realized they hold access to networks of many clients.
Over the past year, the professional goods and services industry has recorded victims in 32 out of the 43 Advanced Persistent Threat (APT) campaigns observed, a presence in 74% of all campaigns. This is a significant increase from 23 campaigns in the previous year.
The victims in this industry span multiple segments, as illustrated below:


The professional goods & services industry attracts a diverse range of threat actors, including nation-state actors and financially motivated individuals. This industry serves as a gateway to clients across various sectors and geographies. In 2025, China-aligned groups such as Volt Typhoon, Salt Typhoon, Stone Panda, MISSION2025, Mustang Panda, APT27, and Emissary Panda are leading the activity.
Meanwhile, financially motivated actors like Lazarus Group, FIN7, FIN11, and TA505 continue to be active. These groups are involved in ransomware, fraud, and access-broker activities. Additionally, we have observed the persistent presence of Russia- and Iran-linked actors, including Gamaredon, Transparent Tribe, Fox Kitten, Cozy Bear, Fancy Bear, and Sandworm.
The increasing number of newly tracked CC- and NS-prefixed clusters indicates a broader actor base. Many groups are utilizing standardized tools and repeatable techniques to target professional services environments.
In 2025, the highest levels of activity are seen in Japan, United States, Australia, India, South Korea, United Kingdom, and Taiwan, where large concentrations of consulting, legal, engineering, and professional services firms operate with broad client visibility.
Sustained victimization is also observed across Southeast Asia and the Asia-Pacific. Additional activity across Europe, the Middle East, and Africa shows growing global distribution of targeting aligned with client reach and cross-border services.
Attacks against the professional goods & services sector continue to focus on the most exposed and widely used technologies, with web applications clearly the primary entry point in both 2024 and 2025. Their dominance reflects their presence in client portals, collaboration platforms, and case or project management systems that are routinely internet-facing.
In 2025, operating systems are targeted more often, showing effort to maintain access and move within networks after the initial compromise. Activity also appears across routers, VPNs, remote desktop tools, and cloud infrastructure, indicating abuse of common remote access paths used by distributed workforces. Smaller but consistent targeting of databases, application servers, monitoring tools, and asset or storage management platforms suggests attackers are reaching into backend systems that store client data.
Overall, the technology pattern seems straightforward: break in through web-facing services, then move into core systems and management tools to stay persistent and extract value. This is consistent with both espionage-driven access and financially motivated campaigns targeting professional services firms.
Over the past 23 months, CYFIRMA’s telemetry has identified 53,154 professional goods & services industry-linked mentions. This is from total of 2.5 million posts across various underground and dark web channels and forums.
The chart above shows total counts of industry-linked mentions for the industry and individual categories of context for the mentionsThe chart below shows year-over-year growth for each category in this industry.
Underground & dark web chatter around the professional goods & services sector rises sharply from late 2024 into 2025, pointing to increased forums activity, likely correlated to attack activity. Data breaches and data leaks dominate discussions, with consistently high volumes across both years, showing ongoing exposure of client records, case data, credentials, and internal documents.
Ransomware chatter shows the most dramatic volatility in 2025, spiking early in the year, dropping off sharply and elevating towards the end of the year again, which fits sustained extortion pressure on consulting, legal, and professional services firms that hold sensitive third-party data. Mentions of claimed hacks and web exploits also increase, reflecting more frequent advertising of successful compromises and access to professional services environments.
DDoS and hacktivism remain secondary but more visible in 2025, appearing in short bursts usually linked to geopolitical or social events.
Overall, the 2025 chatter pattern reflects persistent, monetization-driven targeting, centered on data theft and ransomware, with disruption activity appearing opportunistically.
Over the past 23 months, CYFIRMA’s telemetry has identified 1,372 professional goods & services industry-linked mentions. This is from over 90k CVEs reported and updated in the same time period.
The chart above shows total counts of industry-linked mentions of industry’s technology and individual categories of reported vulnerabilities.The chart below shows year-over-year growth for each category in this industry.
Reported CVEs affecting the professional goods & services technology show substantial exposure to high-impact vulnerability classes, with 2025 maintaining higher and more consistent volumes than 2024. Remote and arbitrary code execution (RCE/ACE) vulnerabilities remain the most significant category, appearing regularly throughout 2025 and highlighting ongoing risk of direct system compromise in environments that handle sensitive client data.
Injection attacks and XSS-related flaws continue to appear at moderate levels, reflecting persistent weaknesses in web applications and client-facing systems that are widely used across professional services firms. Memory and buffer vulnerabilities show occasional spikes in 2025, pointing to deeper technical issues that can support post-compromise activity rather than simple perimeter exploitation.
Other categories – including denial-of-service, privilege escalation, information disclosure, and directory traversal issues – remain present but comparatively low in volume.
Overall, the 2025 CVE profile suggests continued discovery of exploit-ready vulnerabilities that enable access, control, and follow-up activity, rather than a surge in low-impact or configuration-related issues.
In the past 12 months, CYFIRMA has identified 915 verified professional goods & services industry ransomware victims. Sustained volume with only a minor 1.8% increase from 899 in 2024. Still relatively mild, but more significant at 15.2% up from 794 victims in 2023.
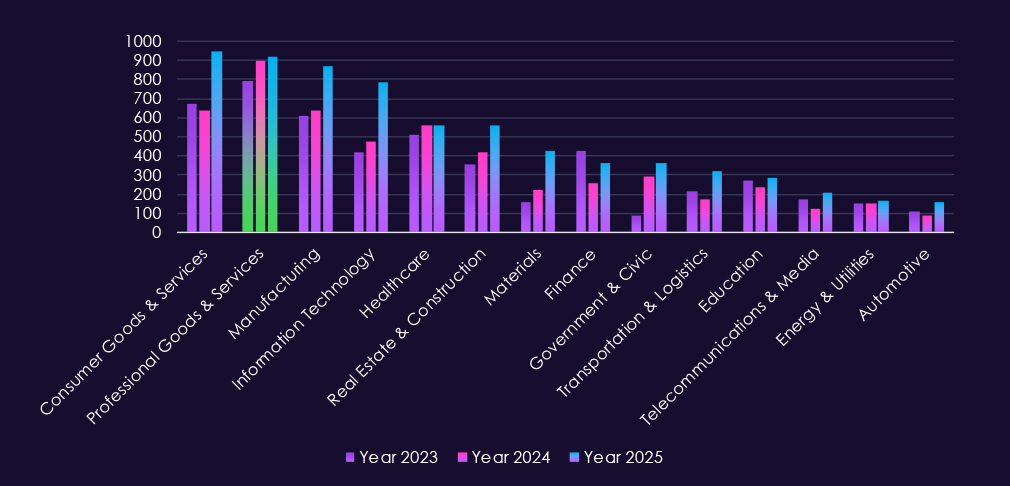
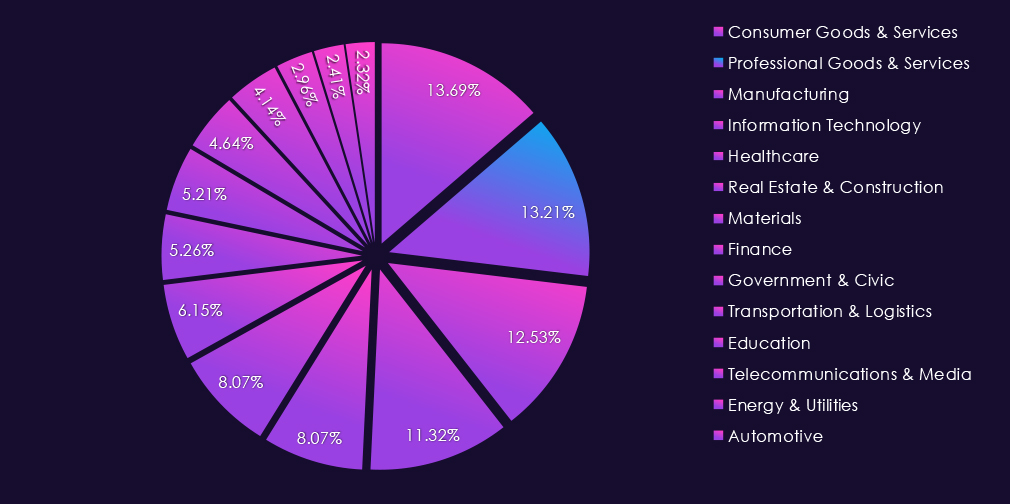
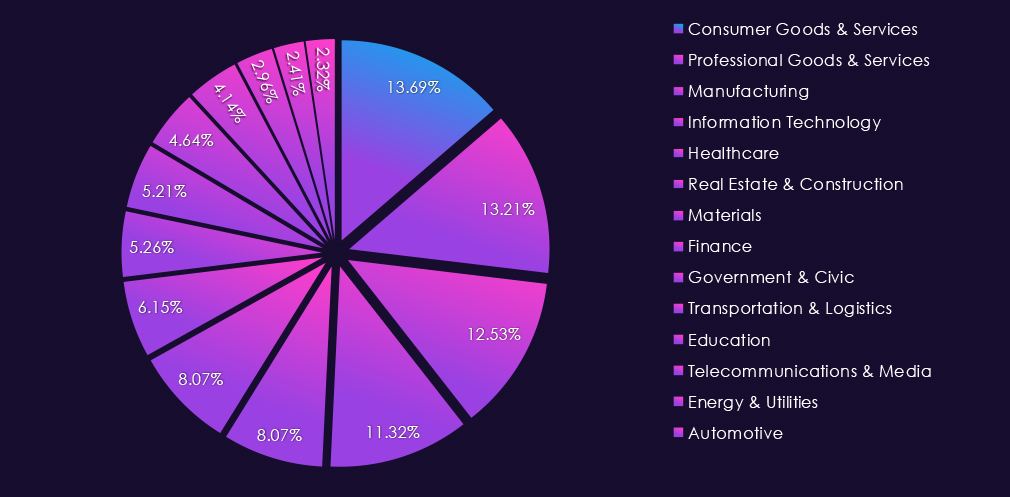
Professional goods & services victims account for 13.21% of all 7,099 ransomware victims during the same period. That is a major decline from 17.22% in 2024 and also from 15.85% in 2023. This shows that despite a higher victim count, the overall ransomware activity is shifting towards other industries.
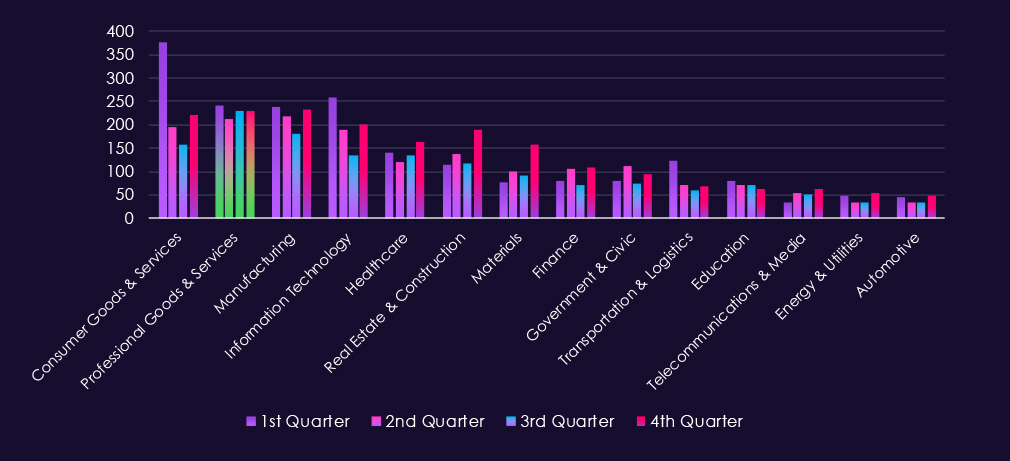
Bar chart above is focused only on 2025 and victims counts per quarters for clear and easy to see trends. Professional goods & services show remarkably even and sustained activity across quarters. This is most likely due to very diverse range of SMEs bundled in this industry category.
Monthly activity charted over scaled-down global all industries victims counts reflects the fact that this industry category is a large portion of all victims. Therefore, the trendline in general follows the global trend. In 2024, July and August recorded a major spike above the global line with another in November.
The start of 2025 was the other way around, where February’s spike did not affect this industry as severely. July shows a mild spike over the global line, but October and November stayed flat compared to the global end-of-the-year elevation. 2025 trendline really illustrates the decline in overall share of all victims discussed on previous page.
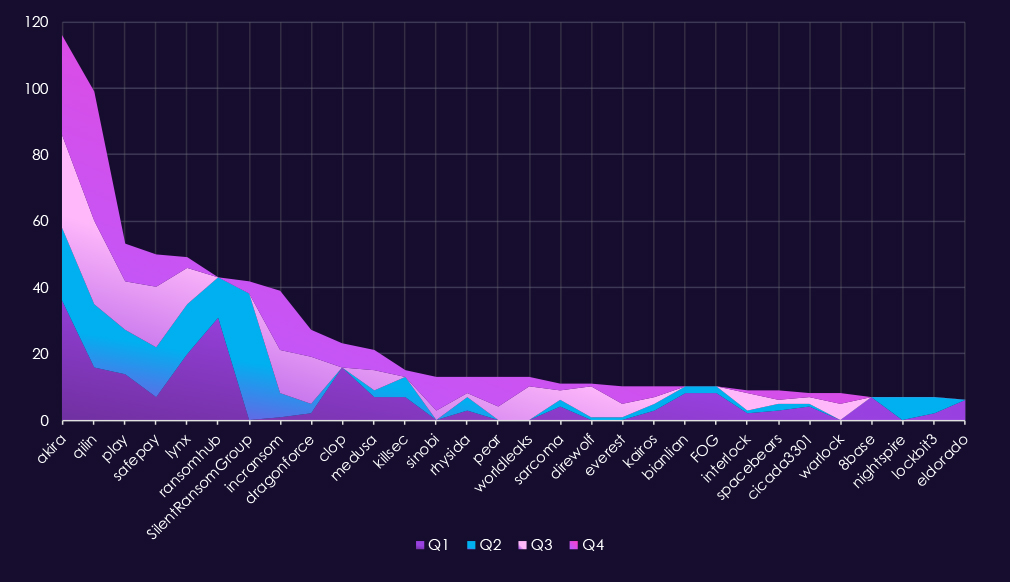
In total 93 out of 124 gangs recorded victims across professional goods & services businesses, amounting to 75% participation.A review of quarterly top 30 gangs’ activity in 2025 shows multiple gangs maintaining sustained activity and notable surges in the second half of the year.
Q1 activity was led by Akira (36) and RansomHub (31), followed by Lynx (20), Qilin (16), and Clop (16). The distribution indicates broad targeting by several established actors rather than concentration around a single dominant group.
In Q2, activity remained elevated but shifted in composition. SilentRansomGroup (38) emerged abruptly as the most active gang, while Akira (22), Qilin (19), SafePay (15), and Lynx (15) maintained steady pressure. Several Q1-heavy actors, including RansomHub and Clop, dropped off sharply.
Q3 marked a redistribution of activity. Qilin (25) and Akira (28) led the quarter, with SafePay (18), Play (15), and IncRansom (13) also recording significant volumes. New or resurging actors such as WorldLeaks (10) and DireWolf (9) contributed to a broader threat landscape.
By Q4, activity intensified slightly. Qilin (39) dominated the quarter, followed by Akira (30) and IncRansom (18). Several groups, including Sinobi (10), Pear (9), and DragonForce (8), showed notable late-year increases, while SilentRansomGroup reappeared at a much lower level.
Overall, professional goods and services experienced sustained ransomware activity throughout 2025. However, the activity rotated among several high-capacity actors, with Akira emerging as the most persistent threat throughout the year, while episodic surges from other groups suggest a mix of long-running campaigns and short-term targeting waves.
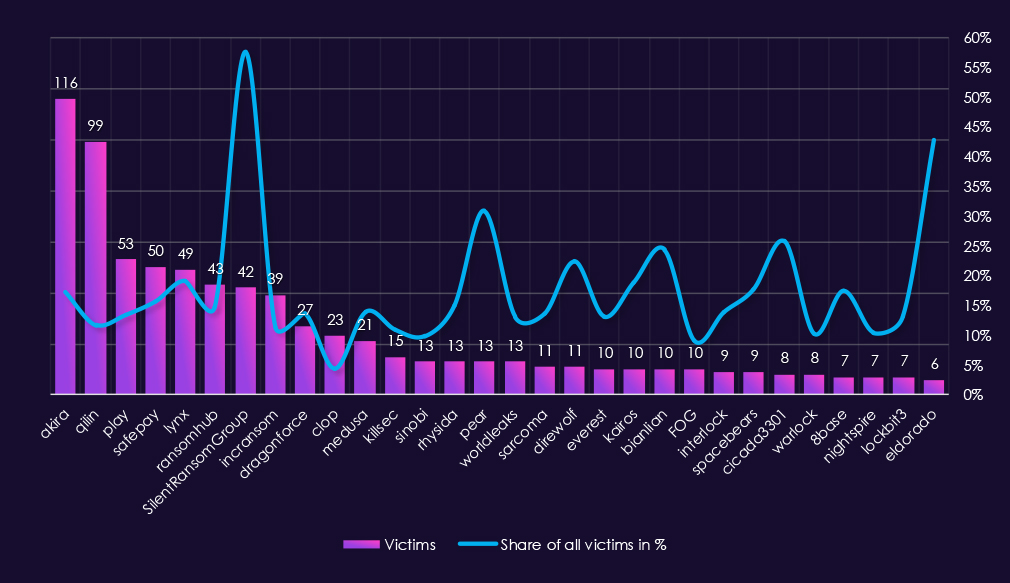
Analyzing 2025 professional goods & services victim counts alongside top 30 gangs’ share of total victims shows both high absolute exposure and a notable concentration of gangs for which this sector represents a significant portion of activity.
By sector victim count, Akira (116) and Qilin (99) were the most active gangs, followed by Play (53), SafePay (50), and Lynx (49). For these high-volume actors, professional goods & services account for 11%–19% of their total victims, indicating sustained engagement with the sector rather than incidental targeting. RansomHub (43 victims, 14.8%) and IncRansom (39 victims, 11.4%) show similar patterns.
Several gangs demonstrate very high proportional exposure (>20%), indicating a strong sector focus. SilentRansomGroup stands out most clearly, with 57.5% of its total victims in professional goods & services. Other notable examples include Eldorado (42.9%), Pear (31.0%), DireWolf (22.4%), BianLian (24.4%), and Cicada3301 (25.8%). These figures suggest this sector played a central role in these groups’ operations during 2025.
A number of elevated percentage values are influenced by relatively low total victim counts. Groups such as Eldorado, Pear, Cicada3301, and DireWolf recorded fewer than 15 sector victims, meaning small absolute changes can skew their percentage shares and should be interpreted with caution.
Most remaining gangs fall into higher focus range (10%–20%), including DragonForce, Medusa, Sarcoma, Everest, Kairos, Interlock, and LockBit3, indicating professional goods & services was a consistently targeted but not exclusive sector.
Overall, professional goods & services emerges as a high-interest ransomware target in 2025, with strong alignment between absolute victim volume and proportional exposure. While some extreme percentages reflect smaller victim pools, the number of gangs with double-digit shares suggests sustained and deliberate targeting across the ransomware ecosystem.
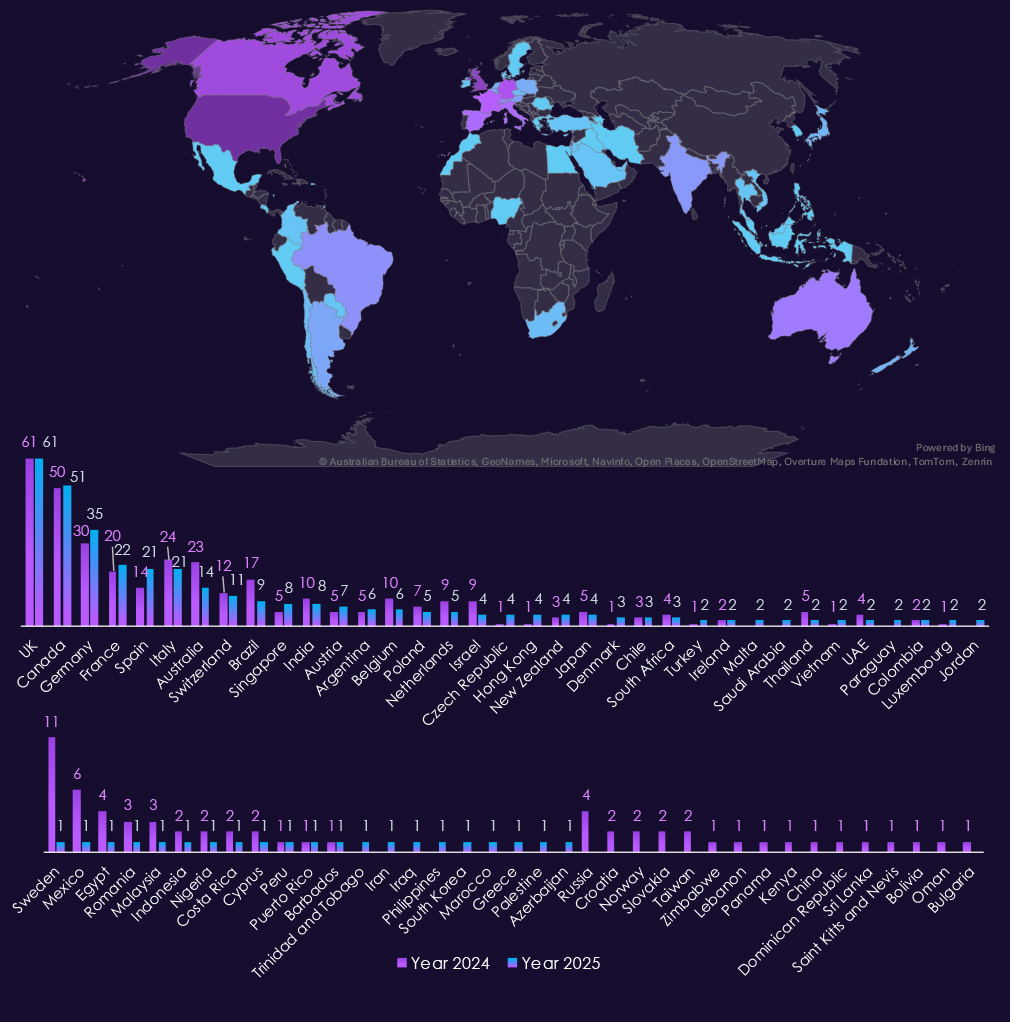
A staggering 550 (60%) victims are from the United States. An increase from 490 the previous year.
Remarkably among the most attacked countries only Germany and Spain recorded a major increases. Many countries recorded a decline in victim numbers, most notably Sweden, Mexico, Australia or Brazil.
There are a number of countries which lost or gained handful of victims, due to opportunistic nature of cybercrime and ransomware.
Overall, 57 countries recorded victims during 2025. Three fewer than 60 in previous year.
Year-over-Year Risk Elevation: Moderate

In 2025, the professional goods & services sector experienced a significant increase in APT exposure, with victims observed in 74% of tracked campaigns, up sharply from 2024. Activity reflects the sector’s role as a gateway to downstream clients across multiple industries, attracting both nation-state and financially motivated actors. Targeting was globally distributed, with emphasis on regions hosting dense concentrations of consulting, legal, engineering, and professional services firms with broad client visibility.
Attack activity continued to originate primarily from web applications, reflecting widespread exposure across client portals, collaboration platforms, and project management systems. Compared to 2024, 2025 showed greater focus on operating systems and remote access technologies, alongside routers, VPNs, cloud infrastructure, and backend platforms. This pattern indicates campaigns moving from initial compromise into persistent access and internal system abuse, consistent with both espionage-driven access and monetization-focused cybercrime.
Underground and dark web chatter remained very high throughout 2025, dominated by data breaches, data leaks, ransomware, and exploit-related discussions. Ransomware chatter escalated further, reflecting sustained extortion pressure against firms holding sensitive client data and privileged access. Mentions of claimed hacks and web exploits also increased, while DDoS and hacktivism activity appeared intermittently rather than as sustained drivers.
Ransomware victimization remained consistently high, with only marginal year-over-year growth but a declining share of global ransomware activity, indicating relative de-prioritization as other sectors accelerated. Despite this, participation remained broad, with three-quarters of active ransomware gangs recording victims in the sector and many showing meaningful proportional focus. The United States accounted for the majority of victims, while geographic exposure remained wide, reinforcing professional goods & services as a persistently targeted, access-rich sector entering 2026.
Over the past year, the consumer goods and services industry has been a victim of 19 out of the 43 Advanced Persistent Threat (APT) campaigns observed. This represents a significant presence, with 44% of all 2025 campaigns targeting this industry.
The victims of these campaigns have come from various sectors within the industry, as illustrated below:

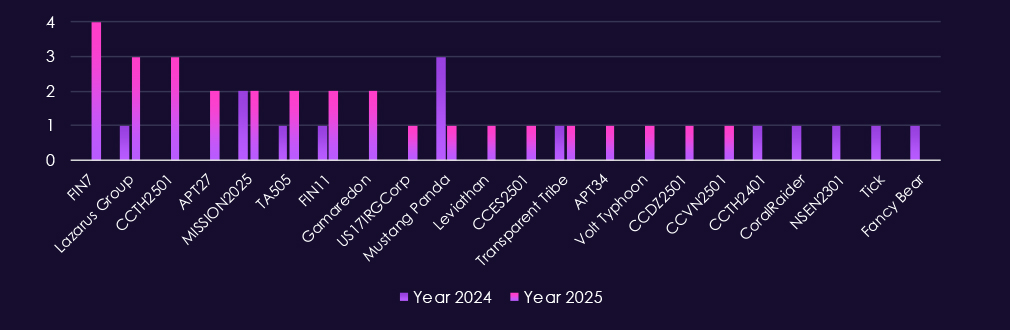
The consumer goods & services sector is primarily targeted by financially motivated actors, reflecting its direct access to payment data, customer information, and high-volume transaction platforms. In 2025, activity is led by cybercrime syndicates FIN7, FIN11, and TA505. Their continued presence aligns with attacks against retailers, online services, and consumer-facing platforms where scale and speed directly translate into profit.
At the same time, state-linked actors remain active, including Lazarus Group, MISSION2025, Mustang Panda, APT27, APT34, and Gamaredon, indicating interest beyond pure profit, including data collection, influence, or regional intelligence.
The appearance of several newly tracked CC-prefixed groups in 2025, indicates growing threat landscape.
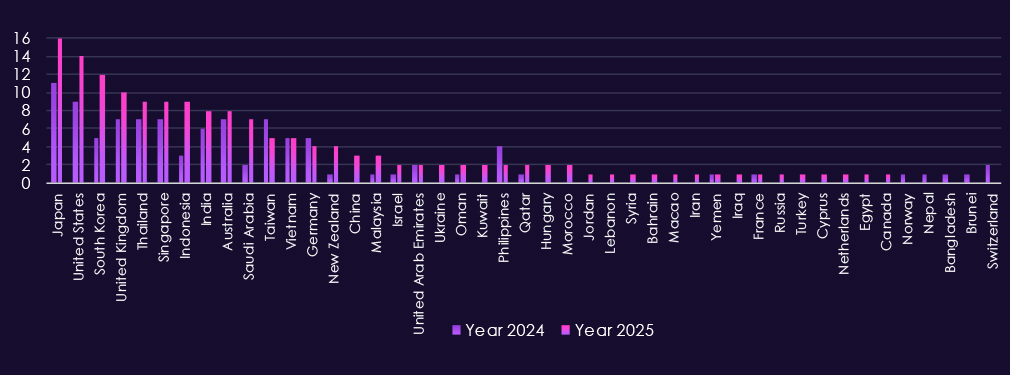
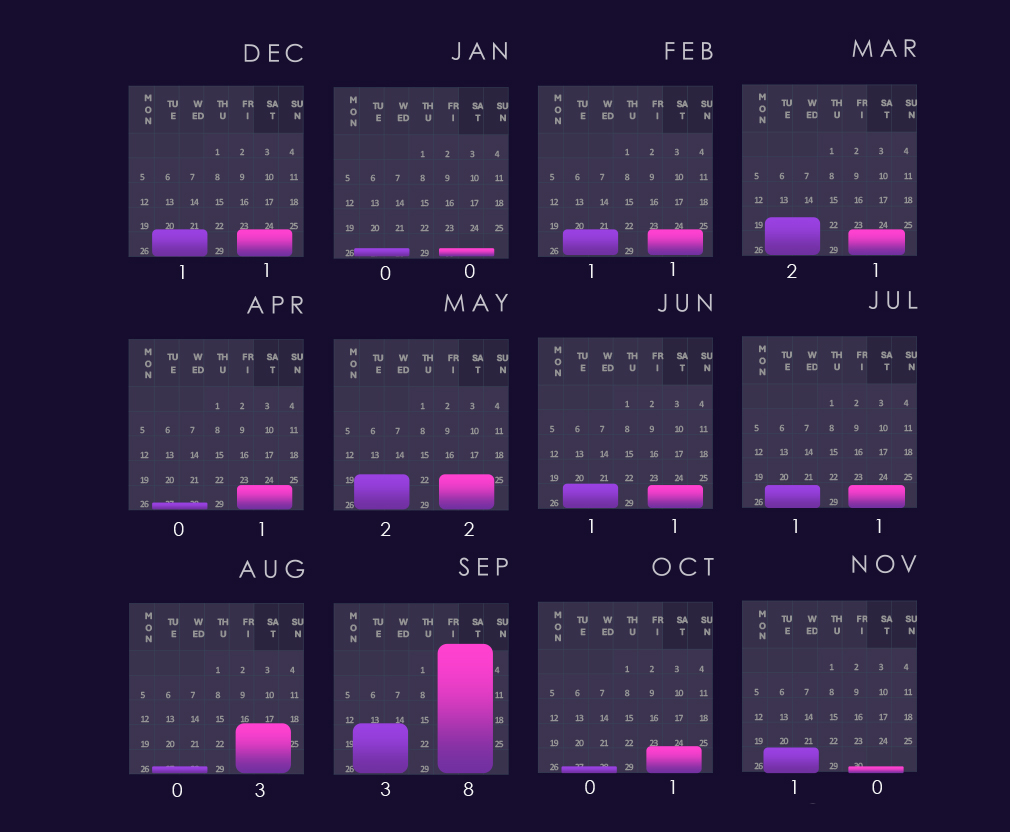
Consumer Goods & Services campaigns show a wide spread of victims, with the highest volumes in Japan (16), United States (14), South Korea (12), and the United Kingdom (10) in 2025. Activity is also consistently high across Singapore (9), Thailand (9), Indonesia (9), Australia (8), India (8), and Saudi Arabia (7), which points to a mix of large consumer markets and regional hubs being targeted.
Beyond the top tier, the victim set broadens further across Taiwan, Vietnam, Germany, New Zealand, and Malaysia, plus a long tail across the Middle East and parts of Europe Overall, it looks like campaigns that scale through shared platforms and supply chains, where compromises in one environment can be reused across many consumer-facing brands and service providers.
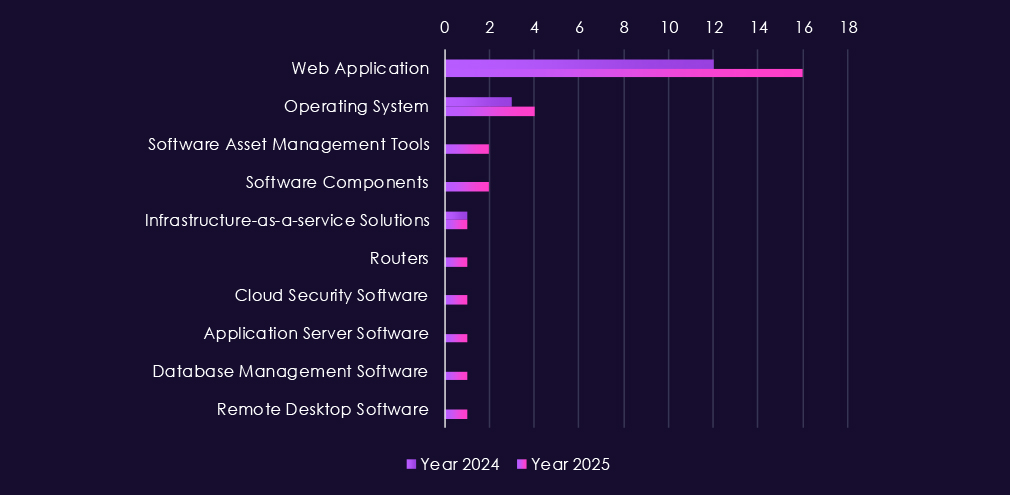
Attacks observed in consumer goods & services APT campaigns continue to center on common, high-exposure enterprise technologies, with web applications again serving as the primary entry point in both 2024 and 2025. This reflects heavy reliance on e-commerce platforms, customer portals, loyalty systems, and third-party service integrations that are routinely internet-facing.
In 2025, operating systems are targeted more frequently, pointing to breach activity aimed at persistence and internal movement after initial access. Smaller but consistent targeting of application servers, databases, and software components suggests attempts to reach customer records, transaction data, or shared backend services. Activity against remote desktop software, routers, and cloud or asset management tooling highlights abuse of standard administrative and remote access paths commonly used in consumer-facing environments.
Overall, the technology pattern is direct. Gain access through exposed web services, then move into core systems and management layers to extract data or maintain access, aligning with mostly monetization-driven cybercrime activity targeting the consumer sector.

Over the past 23 months, CYFIRMA’s telemetry has identified 40,453 consumer goods & services industry-linked mentions. This is from total of 2.5 million posts across various underground and dark web channels and forums.
The chart above shows total counts of industry-linked mentions for this industry and individual categories of context for the mentions
The chart below shows year-over-year growth for each category in this industry.
Underground & dark web chatter around the consumer goods & services sector remains consistently high and increases further in 2025, reflecting ongoing attack activity and frequent public exposure. Data breaches and data leaks dominate discussion, with large monthly volumes across both years, indicating sustained exposure of customer data, account information, and transaction records.
Ransomware chatter escalates noticeably in 2025, with sharp spikes early and mid-year, aligning with continued extortion pressure against consumer-facing businesses where brand impact and service disruption increase leverage. Mentions of claimed hacks and web exploits also rise, pointing to active advertising of compromised access and exploitation of exposed platforms.
DDoS and hacktivism activity remains secondary but visible, appearing in bursts rather than sustained campaigns, often tied to short-lived protest or disruption events.
Overall, the 2025 chatter pattern reflects persistent, monetization-driven targeting, centered on data theft and ransomware, with opportunistic disruption layered on.
Over the past 23 months, CYFIRMA’s telemetry has identified 1,308 consumer goods & services industry-linked mentions. This is from over 90k CVEs reported and updated in the same time period.
The chart above shows total counts of industry-linked mentions for consumer goods & services technology and individual categories of reported vulnerabilities.
The chart below shows year-over-year growth for each category in this industry.
Reported CVEs in the consumer goods & services sector are dominated by web-facing vulnerability classes, reflecting heavy reliance on e-commerce platforms, customer portals, and third-party integrations. Across both 2024 and 2025, injection attacks and remote/arbitrary code execution (RCE/ACE) stand out as the most frequent issues, highlighting continued risk of direct compromise through poorly secured application logic and backend services.
In 2025, injection attacks show clear growth and sustained monthly activity, reinforcing that web applications handling payments, user accounts, and order management remain a primary weakness. RCE/ACE vulnerabilities also remain consistently present, indicating ongoing exposure to flaws that allow attackers to move quickly from initial access to full system control. XSS and clickjacking appear regularly but at lower levels.
Other vulnerability classes – including memory corruption, privilege escalation, denial-of-service, and information disclosure – appear intermittently and at lower volumes, typically supporting post-compromise activity rather than serving as initial entry points.
Overall, the CVE profile for consumer goods & services reflects a straightforward risk picture where exploitable web application flaws can enable fast access to customer data, transactions, and monetization paths, rather than complex or highly specialized vulnerabilities.
In the past 12 months, CYFIRMA has identified 948 verified consumer goods & services industry ransomware victims, an all-time high for any industry. It is a major 48% increase from 640 victims in the previous year, which was slightly below 675 victims in 2023. Such high numbers come from the ubiquitous presence of many small and medium-size retailers.
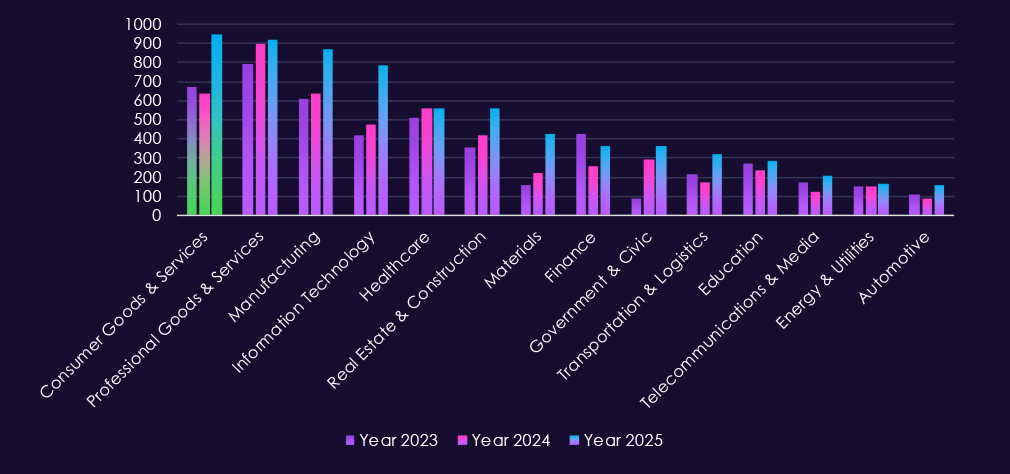
The Consumer goods & services industry accounted for 13.69% of the overall total of 7,099 ransomware victims during the same period. Ranking at the most frequent target of ransomware for the year. It is also an increase from 12.26% in the previous year, but only slightly above 13.48% in 2023.
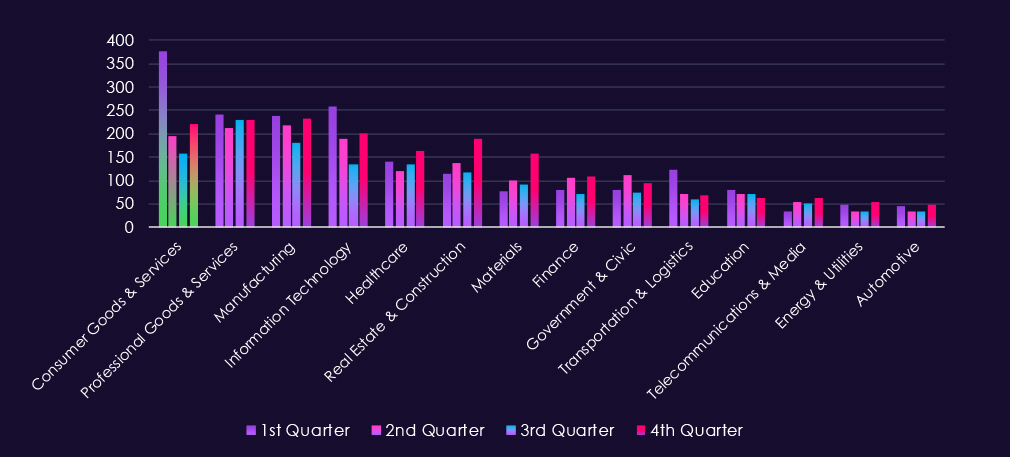
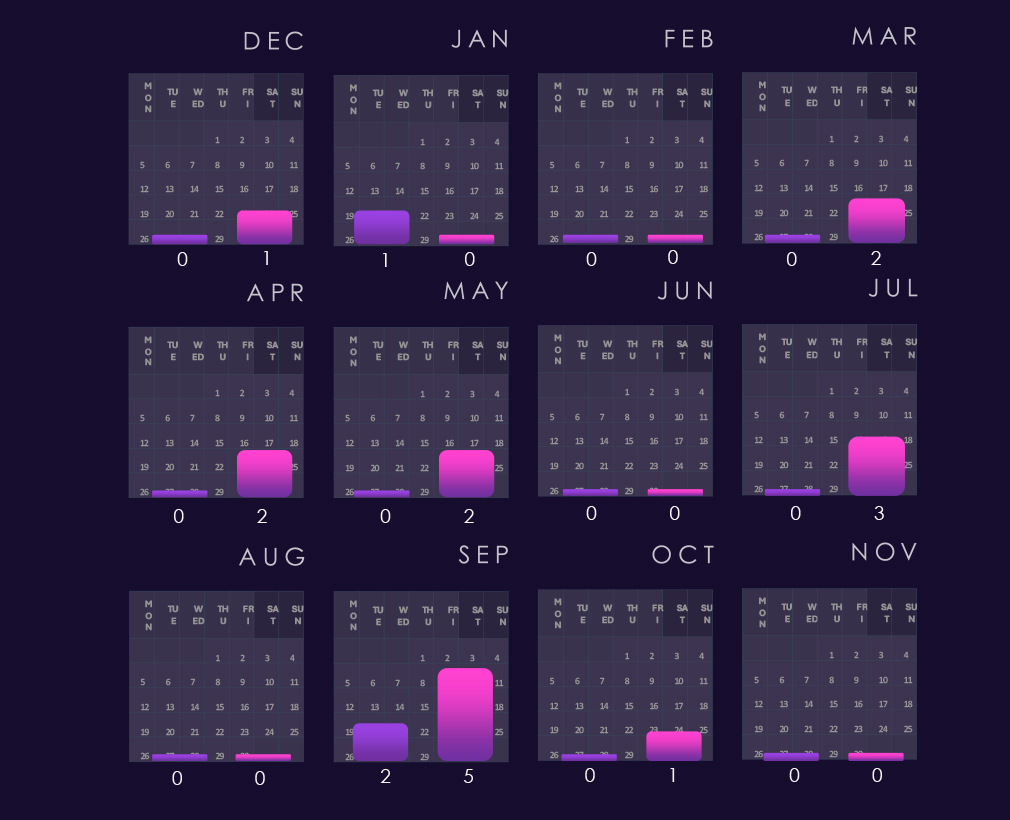
Bar chart above is focused only on 2025 and victims counts per quarters for clear and easy to see trends. Consumer goods & services experienced the worst Q1 of all industries. Q2 and especially Q3 were significantly calmer, However Q4 showed another elevation, fortunately nowhere near the Q1 levels.
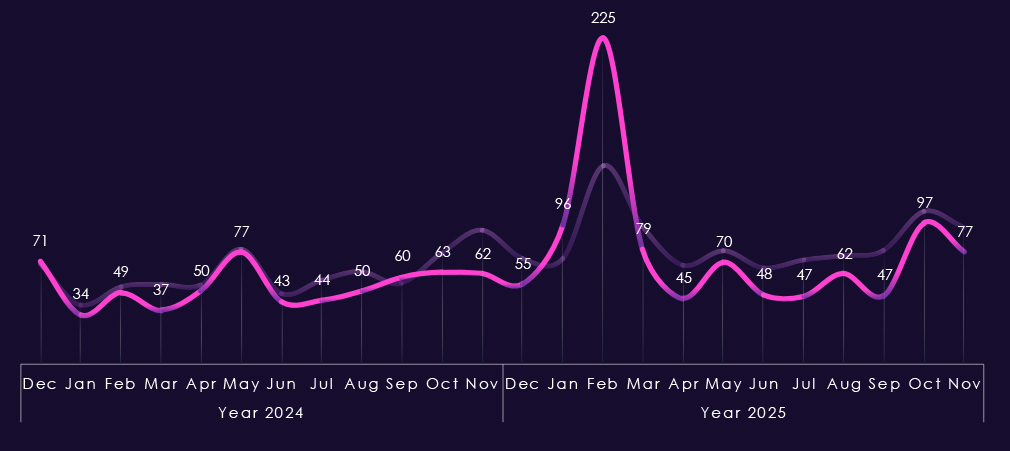
Monthly activity charted over scaled-down global all industries victims counts shows us that 2024 was mostly flat, though mildly growing line, only May showing a spike in line with global activity.
2025 though recorded elevation starting already in January followed by a disproportionately high spike during February. The rest of the 2025 was below global trendline, including the May and October peaks.

In total 89 out of 124 gangs recorded victims in consumer goods & services industry, 72% participation.
A breakdown of quarterly top 30 ransomware gangs’ activity against the consumer goods & services sector in 2025 shows very high volatility, with extreme early-year concentration followed by shifting leadership and a sharp rise in late-year activity.
Q1 activity was overwhelmingly dominated by Clop (161), accounting for the vast majority of observed victims during the quarter. Akira (34), RansomHub (26), and Cactus (24) followed at a much lower level. This distribution is result of a highly concentrated specific exploit-driven campaign by Clop.
In Q2, activity dropped sharply from Q1 levels and became more distributed. SafePay (20) and Akira (20) led the quarter, while RansomHub (15), Play (15), and Qilin (11) showed moderate activity. Several Q1-dominant actors, including Clop and Cactus, declined significantly.
Q3 marked a shift in leadership and renewed momentum. Qilin (24) emerged as the most active gang, followed by Play (11), SafePay (11), and DragonForce (13). Activity broadened across more actors, though volumes remained way below the Q1 peak.
By Q4, activity escalated again. Qilin (44) clearly dominated the quarter, while Akira (19), Clop (18), and IncRansom (11) showed strong late-year activity. Several gangs, including Sinobi (17) and ShinyHunters (14), appeared abruptly in Q4, contributing to a pronounced long tail of new or resurging actors.
Overall, consumer goods & services experienced highly uneven ransomware pressure in 2025. The sector was shaped by a single extreme surge early in the year, followed by more distributed activity and new late-year escalation led by Qilin. Patterns suggest a mix of large-scale campaigns and opportunistic targeting.
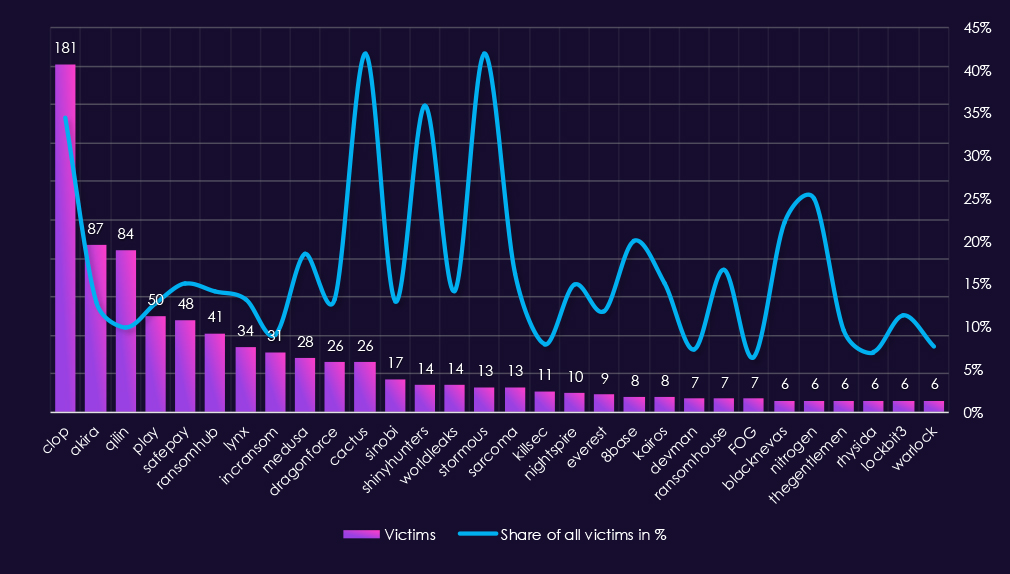
Reviewing 2025 consumer goods & services victim counts alongside top 30 gangs share of total victims shows both extremely high absolute exposure and a large number of gangs for which this sector represents a significant portion of activity.
By sector victim count, Clop (181) was the most active gang, with consumer goods & services accounting for 34.5% of its total victims. This shows how disproportionately this industry was hit by the Clop rampage. Akira (87 victims, 12.9%), Play (50 victims, 12.7%), SafePay (48 victims, 15.0%), and RansomHub (41 victims, 14.1%) also combine high volume with high share, suggesting focused and sustained targeting of the sector.
Several gangs show very high proportional exposure (>20%), indicating consumer goods & services was a primary focus. Notable examples include Cactus (41.9%), Stormous (41.9%), ShinyHunters (35.9%), Nitrogen (25.0%), BlackNevas (22.2%), and 8Base (20.0%). These figures suggest deliberate concentration on consumer-facing targets, though some are influenced by smaller overall victim pools.
A number of elevated percentage values are driven by moderate to low total victim counts. Groups such as Cactus, Stormous, ShinyHunters, and BlackNevas recorded relatively limited overall activity, meaning their share is sensitive to small changes in volume and should be interpreted cautiously.
Most remaining gangs fall into a moderate focus range (10%–20%), including Medusa, Sarcoma, WorldLeaks, NightSpire, Kairos, and RansomHouse, indicating consumer goods and services was a consistently targeted but not exclusive sector.
Overall, consumer goods & services stands out as a high-priority ransomware target in 2025, with strong alignment between absolute victim volume and proportional exposure across many gangs. While some extreme shares reflect smaller datasets, the number of gangs with double-digit percentages shows sustained and deliberate interest in this sector.
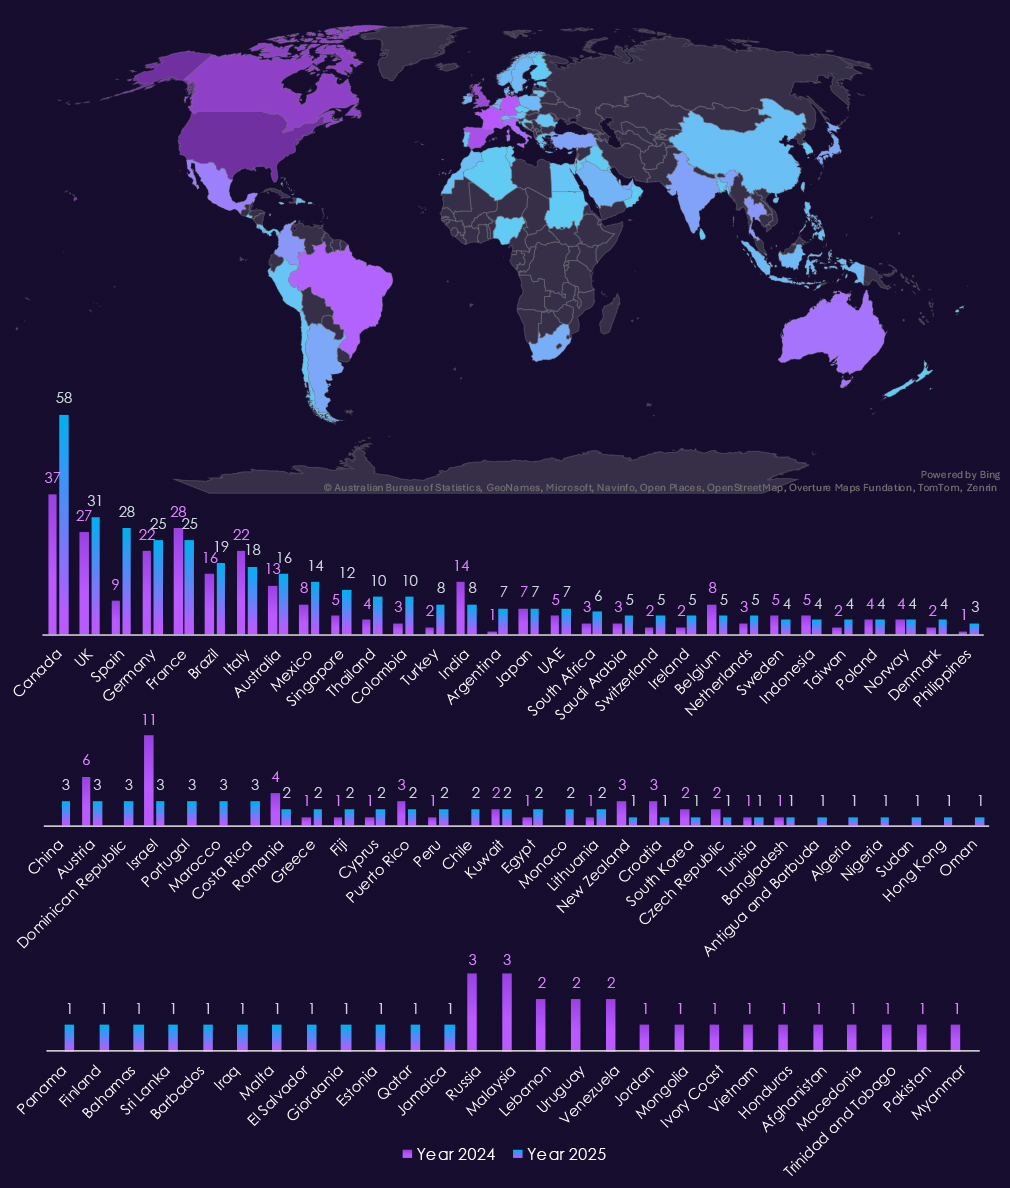
With 515 victims the USA accounts for 54% of all ransomware victims in 2025. The US also recorded major increase from 306 victims in 2024.
Canada, Spain, Mexico, Singapore, Thailand, Colombia, Turkey or Argentina were among the countries with highest increases. Conversely, India, Israel, Belgium or Austria were among countries with decline of victims.
A total of 73 countries recorded victims in 2025, increase from 63 in 2024.
Year-over-Year Risk Elevation: High

In 2025, the consumer goods & services sector experienced elevated APT exposure, with victims observed in 44% of tracked campaigns. Activity was primarily driven by financially motivated actors, reflecting the sector’s direct access to payment data, customer information, and high-volume transaction platforms. At the same time, continued presence of state-linked actors indicates secondary interest in data collection, influence, and regional intelligence beyond pure monetization. Targeting was globally distributed, aligned with large consumer markets and shared platforms rather than individual brands.
Attack activity continued to originate primarily from web applications, reflecting reliance on e-commerce platforms, customer portals, loyalty systems, and third-party integrations. Compared to 2024, 2025 showed increased targeting of operating systems and backend components, alongside databases, application servers, and cloud or asset management tooling. This pattern reflects a straightforward approach: exploit exposed web services, then move into core systems to extract data or maintain access, consistent with scale-driven cybercrime.
Underground and dark web chatter remained consistently high and intensified further in 2025, dominated by data breaches, data leaks, ransomware, and access-sale narratives. Ransomware-related discussion showed sharp spikes early and mid-year, while mentions of claimed hacks and web exploits increased steadily, indicating active advertising of compromised access. DDoS and hacktivism activity remained secondary and episodic, typically tied to short-lived disruption events.
Ransomware victimization reached an all-time high, increasing 48% year over year and making consumer goods & services the most frequently targeted sector by volume in 2025. Activity was highly uneven, shaped by a major early-year surge followed by more distributed targeting and renewed late-year escalation. Participation was broad, with over 70% of active ransomware gangs recording victims in the sector, many showing high proportional exposure. The United States accounted for over half of all victims, while geographic exposure widened further, reinforcing consumer goods & services as a top-tier ransomware target entering 2026.
Over the past 12 months, the real Estate & construction industry recorded victims in 17 out of the 43 Advanced Persistent Threat (APT) campaigns observed – a presence in 40% of the campaigns. It is also a major increase from just 3 campaigns in previous year.
These victims spanned multiple segments within the industry as shown below:


The real estate & construction sector is targeted by a mix of financially motivated groups and state-linked actors, reflecting the value of financial transactions, project data, and access to broader commercial ecosystems. In 2025, activity is led by Stone Panda, MISSION2025, Volt Typhoon, Salt Typhoon, and Mustang Panda all linked to Chinese government.
At the same time, financially driven Russian groups such as FIN7, FIN11, TA505 and North Korean Lazarus Group remain active.
Additional activity from Russia-linked actors such as Gamaredon, Turla Group, and Fancy Bear, alongside the presence of newly tracked clusters paints growing threat landscapes.
Observed victims are concentrated in countries with active property markets and large construction ecosystems, often tied to cross-border investment and complex supply chains. In 2025, the most frequently affected countries are United States, Japan, South Korea, United Kingdom, India, Australia, Taiwan, and Thailand.
Additional victim activity across Southeast Asia and Europe, including Singapore, Indonesia, Philippines, Germany, France, and Spain.
Overall, the victim spread reflects opportunistic targeting for profit as well as nation-state monitoring of infrastructure projects.
Attacks against the real estate & construction sector focus on a set of common, high-exposure technologies, with web applications again serving as the primary entry point. These systems often support project management, property listings, procurement, and partner collaboration, making them attractive and accessible targets.
In 2025, operating systems are targeted more frequently, indicating follow-up activity aimed at persistence and internal movement after initial access. More selective targeting of routers, RDP, and SMTP services reflects abuse of standard remote access and communication paths used by distributed project teams and contractors.
Activity involving network monitoring tools, application infrastructure, and database platforms suggests attempts to access internal project data, financial records, or gain visibility into operations.
Over the past 23 months, CYFIRMA’s telemetry has identified 7.072 real estate & construction industry-linked mentions. This is from total of 2.5 million posts across various underground and dark web channels and forums.
The chart above shows total counts of industry-linked mentions for real estate & construction industry and individual categories of context for the mentions.
The chart below shows year-over-year growth for each category in this industry.

Underground & dark web chatter linked to the real estate & construction sector increases clearly from late 2024 into 2025, pointing to higher forums and likely also attack activity and more frequent public exposure. Data breaches and data leaks are the dominant themes, with steady growth through 2025, suggesting ongoing disclosure of transaction data, contracts, tenant information, and internal project record.
Ransomware chatter shows the strongest escalation in 2025, rising sharply early in the year and after a dip rising again. This aligns with continued extortion pressure on property firms and construction companies, where downtime, project delays, and financial disruption create leverage. Mentions of claimed hacks and web exploits also rise, indicating more frequent advertising of compromised access and exploitation of exposed systems.
DDoS and hacktivism remain lower-volume and episodic, appearing in short spikes as expected from more event driven activity.
Overall, the 2025 chatter profile reflects persistent, monetization-focused targeting, centered on data exposure and ransomware, with disruption activity playing a secondary role in real estate and construction environments.

Over the past 23 months, CYFIRMA’s telemetry has identified 488 real estate & construction industry-linked mentions. This is from over 90k CVEs reported and updated in the same time period.
The chart above shows total counts of industry-linked mentions for real estate & construction technology and individual categories of reported vulnerabilities.The chart below shows year-over-year growth for each category in this industry.
Reported CVEs affecting the real estate & construction sector remain lower in overall volume than highly software-centric industries, but they consistently cluster around high-impact, easily exploitable flaw types. In both 2024 and 2025, remote and arbitrary code execution (RCE/ACE) vulnerabilities are the most prominent, underscoring continued risk of direct system compromise in platforms used for property management, project coordination, and financial transactions.
In 2025, injection attacks show a noticeable increase, particularly in web-facing systems, reflecting ongoing exposure in applications that support listings, procurement, and partner access. XSS and clickjacking appear intermittently, pointing to persistent weaknesses in client-facing portals rather than deep infrastructure flaws. Denial-of-service vulnerabilities remain present but limited, aligning with the sector’s lower tolerance for disruption but smaller attack surface compared to critical infrastructure industries.
Lower but recurring appearances of memory corruption, privilege escalation, and information disclosure issues indicate potential for follow-up exploitation once initial access is gained.
Overall, the CVE profile reflects a sector where web application security remains the primary risk.
In the past 12 months, CYFIRMA has identified 559 verified real estate & construction industry ransomware victims. A substantial 35% increase from 415 victims in the previous year and 59% from 352 victims in 2023.
Real estate & construction accounted for 8.07% of the 7,099 ransomware victims in 2025. That is a very minor increase from 7.95% in the previous year but a more significant bump from 7.03% in 2023.

Bar chart above is focused only on 2025 and victims counts per quarters for clear and easy to see trends. The first three quarters were relatively evenly active, just in Q2 there was a modest uptick. Q4, however, shows a major jump with implied elevation into 2026.
Monthly activity charted over scaled-down global all industries victims counts shows 2024 aligned with global trendline for the most part. Most notable is November 2024 peak.
In 2025 real estate & construction avoided the brunt of February spike and except more pronounced May spike followed the global trend until August. From September we can see divergence above the global trendline further suggesting elevation into 2026.
In total 81 out of 124 gangs recorded victims in real estate & construction industry. That is 65% participation.An analysis of quarterly top 30 ransomware activity in 2025 shows rising pressure over the year, with clear escalation in the last quarter and increasing concentration among a small number of leading actors.
Q1 activity was led by RansomHub (21) and Akira (16), followed by Play (11) and Lynx (9). Activity was relatively distributed across several gangs, suggesting opportunistic targeting rather than sustained campaigns early in the year.
In Q2, activity increased and became more competitive. Akira (20) and Play (17) led the quarter, while SafePay (17) also showed a sharp increase. Qilin (8) and KillSec (7) added to overall pressure, while RansomHub declined sharply from its Q1 peak.
Q3 marked a shift in leadership. Qilin (15) emerged as the most active gang, followed by Akira (14) and Play (10). Several additional actors, including Sinobi (4) and Interlock (4), increased activity, contributing to a broader but still moderate threat landscape.
By Q4, activity escalated significantly. Qilin (42) dominated the quarter by a wide margin, while Akira (32) and Play (17) maintained strong activity. Sinobi (13) emerged abruptly as a major contributor, and several other gangs recorded low but persistent activity, indicating a mix of sustained campaigns and short-lived targeting waves.
Overall, real estate and construction experienced a clear upward trend in ransomware activity through 2025. Early-year activity was relatively dispersed, but the second half of the year was increasingly shaped by Qilin and Akira, with Q4 reflecting both heightened volume and greater concentration among leading actors.
A review of the 2025 real estate & construction victim counts alongside top 30 gangs’ share of total victims shows a mix of sustained high-volume activity and several proportionally focused outliers.
By sector victim count, Akira (82) and Qilin (68) were the most active gangs. For Akira, real estate & construction accounts for 12.2% of total victims, indicating a meaningful but not exclusive focus. Qilin shows a lower proportional exposure at 8.0%, suggesting broad targeting despite high sector volume. Play (55 victims, 14.0%) and SafePay (34 victims, 10.7%) combine substantial volume with elevated sector share, pointing to sustained engagement with the sector.
Several gangs show relatively high proportional exposure (>10%). Notable examples include DragonForce (13.7%), Sinobi (13.0%), Interlock (13.8%), J (17.5%), ArcusMedia (12.8%), Nova (10.6%), Nitrogen (20.8%), Beast (11.4%), Anubis (14.3%), and Frag (18.2%). These figures suggest real estate & construction represented a significant share of activity for a diverse set of actors.
A small number of extreme percentage values are driven by low overall victim counts. Radar (36.4%) is the clearest outlier, reflecting four sector victims against a very small total victim pool. Similar skew is visible for Nitrogen, Frag, and J, and should be interpreted cautiously.
Most remaining gangs fall into a low to moderate focus range (<10%), including RansomHub, Lynx, WorldLeaks, Sarcoma, Hunters, and BianLian, indicating opportunistic or secondary targeting rather than sector specialization.
Overall, real estate and construction shows broad ransomware interest with selective specialization. Several high-volume gangs maintain consistent pressure on the sector.
Recording 341 victims, the USA accounts for the majority (61%) of real estate & construction industry victims in 2025. The US also recorded a major increase from 228 victims in 2024.
Singapore is an outlier and went from no to 10 victims. Germany, France, Sweden, Malaysia, and Qatar also recorded increases. Overall, the numbers are relatively stable compared to other industries. The major focus continues to be on the US.
A total of 52 countries recorded victims in 2025, only three more than in 2024.
Year-over-Year Risk Elevation: High

In 2025, the real estate & construction sector experienced a sharp year-over-year increase in APT exposure, with victims observed in 40% of tracked campaigns, up from just three campaigns in 2024. Activity reflects a blend of financially motivated cybercrime and state-linked interest, driven by the sector’s role in large financial transactions, infrastructure development, and complex commercial ecosystems. Targeting remained globally distributed, with emphasis on markets supporting active property investment, large-scale construction, and cross-border supply chains.
Attack activity continued to originate primarily from web applications, reflecting their widespread use for project management, property platforms, procurement, and partner collaboration. Compared to 2024, 2025 showed greater follow-on activity against operating systems and remote access technologies, alongside routers, RDP, SMTP services, and selected backend platforms. This pattern indicates movement from initial compromise into persistence and internal visibility, consistent with both monetization-focused intrusion and infrastructure monitoring.
Underground and dark web chatter increased noticeably from late 2024 into 2025, dominated by data breaches, data leaks, and ransomware-related discussions. Ransomware chatter showed the strongest growth, aligning with extortion pressure where project delays, operational disruption, and financial exposure increase leverage. Mentions of claimed hacks and web exploits also rose, while DDoS and hacktivism activity remained lower-volume and episodic.
Ransomware victimization increased 35% year over year, with the sector maintaining a stable but gradually rising share of global ransomware victims. Activity intensified in the second half of 2025, with greater concentration among a small number of leading gangs by Q4. Participation was broad, with nearly two-thirds of active ransomware gangs recording victims in the sector. The United States accounted for the majority of victims, while overall geographic spread remained relatively stable, reinforcing real estate & construction as a steadily escalating ransomware target entering 2026.
Over the past year, government and civic organizations recorded victims across 37 out of the 43 Advanced Persistent Threat (APT) campaigns observed, resulting in an incidence rate of 86%. This is a significant increase compared to the 29 campaigns observed in the previous year.

Government & civic organizations remain one of the most heavily targeted sectors, with activity in 2025 driven mainly by espionage-focused actors and supported by steady cybercrime pressure. China-linked groups such as Volt Typhoon, Salt Typhoon, Stone Panda, MISSION2025, Mustang Panda, APT27, and Emissary Panda account for a large share of observed campaigns.
At the same time, financially motivated groups including FIN7, FIN11, and TA505 continue to operate in this space, reflecting ransomware, fraud, and access resale activity even against government-linked environments. Lazarus Group again appears in this overlap, consistent with its pattern of mixing intelligence collection with revenue generation.
Additional campaigns attributed to Russia- and Iran-linked actors such as Gamaredon, Transparent Tribe, Fox Kitten, APT34, Fancy Bear, and Sandworm highlight ongoing intelligence and influence operations targeting public institutions. The growing number of CC- and NS-prefixed clusters observed in 2025 highlights a wider pool of actors.

Victims are concentrated in politically and economically significant countries. In 2025, the most frequently affected countries are Japan, United States, South Korea, India, United Kingdom, Australia, and Taiwan.
Further, the activity spans Southeast Asia, the Middle East, and parts of Europe, including Thailand, Vietnam, Indonesia, Singapore, Saudi Arabia, United Arab Emirates, Germany, and France. The overall spread shows broad, persistent targeting of government institutions across allied, regional, and strategic states, consistent with sustained intelligence-gathering and geopolitical monitoring campaigns.
Attacks against government & civic organizations focus heavily on widely deployed, externally exposed technologies, with web applications the main entry point in both 2024 and 2025. These systems support public services, internal portals, and inter-agency workflows, making them frequent targets for initial access.
In 2025, operating systems are targeted more often, showing greater emphasis on persistence and lateral movement after compromise. Activity also extends into databases, application infrastructure, and network monitoring tools, indicating efforts to access sensitive records, gain visibility, or maintain long-term access. More limited targeting of VPNs, remote desktop tools, routers, and cloud-related services reflects abuse of standard remote access paths used across government environments.
Overall, the pattern is initial access through web-facing services, followed by movement into core systems and management layers, aligning with long-term espionage objectives and, in some cases, follow-on monetization or disruption.
Over the past 23 months, CYFIRMA’s telemetry has identified 46,513 mentions of government & civic organizations. This is from a total of 2.5 million posts across various underground and dark web channels and forums.
The chart above shows total counts of industry-linked mentions for this industry and individual categories of context for the mentionsThe chart below shows year-over-year growth for each category in this industry.
Underground and dark web activity tied to government & civic organizations shows a clear shift in scale and intensity from 2024 into 2025, with data-centric activity dominating throughout both years.
In 2024, chatter is steady but comparatively contained. Data breaches and data leaks form the bulk of reporting, reflecting ongoing compromise of public-sector systems and the resale or disclosure of government-related data. Ransomware and claimed hacks appear regularly but remain secondary, while DDoS and hacktivist activity spikes briefly around geopolitical events, particularly in late summer and early autumn.
In 2025, volumes increase sharply across nearly all categories. Data breaches and leaks surge, indicating larger-scale intrusions and more frequent disclosure or monetization of government data. Ransomware activity rises significantly, in line with the interest of financially motivated actors targeting public institutions.
DDoS and hacktivism remain elevated, often aligned with political tensions, protests, or international conflicts rather than purely criminal motives. Web exploit chatter grows as well, reinforcing the role of exposed government-facing applications as a primary access vector.
Overall, the pattern reflects a blend of espionage fallout, financial crime, and ideologically driven hacktivism, with government entities consistently appearing as targets due to the sensitivity, visibility, and public impact of compromised public-sector data.
Over the past 23 months, CYFIRMA’s telemetry has identified 607 mentions linked to government & civic organizations. This is from over 90k CVEs reported and updated in the same time period.
The chart above shows total counts of industry-linked mentions for government & civic technology and individual categories of reported vulnerabilities.The chart below shows year-over-year growth for each category in this industry.


Reported CVEs affecting government & civic organizations remain consistently high-impact, reflecting the sector’s broad attack surface and reliance on externally accessible services. Across both 2024 and 2025, remote and arbitrary code execution (RCE/ACE) vulnerabilities are the most prominent category, highlighting persistent risk of direct system compromise in public-sector platforms, citizen services, and administrative infrastructure.
In 2025, injection attacks show a sustained presence, particularly in web-facing systems used for public portals, data submission, and inter-agency access. Cross-site scripting and clickjacking appear regularly, indicating ongoing weaknesses in externally exposed applications rather than deeply embedded system components. Denial-of-service vulnerabilities occur at lower volumes but remain relevant given the operational and public-facing impact of service disruption.
Lower but recurring instances of privilege escalation, information disclosure, and memory-related vulnerabilities point to continued risk of secondary exploitation following initial access.
Overall, the CVE profile reflects a sector where exposure, scale, and system longevity combine to make high-impact vulnerabilities persistent, with web applications and externally reachable services remaining the primary areas of risk
In the past 12 months, CYFIRMA has identified 361 verified government & civic organization victims of ransomware. That is substantial 22% increase from 223 victims in 2024 and massive 306% from 89 victims in 2023.

Government & civic organizations account for 5.21% of the overall total of 7,099 ransomware victims during the same period. That is a dip from 5.65% in the previous year and significantly higher than 1.78% during 2023.
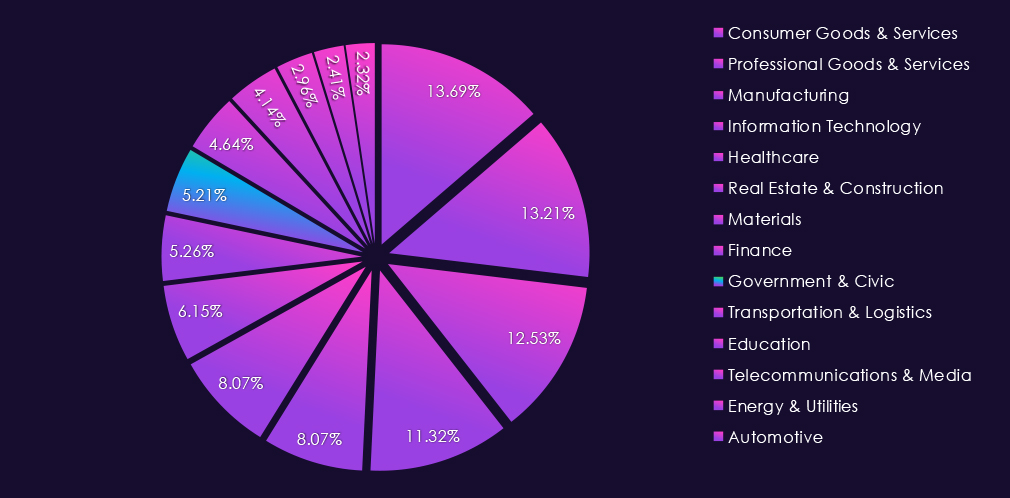
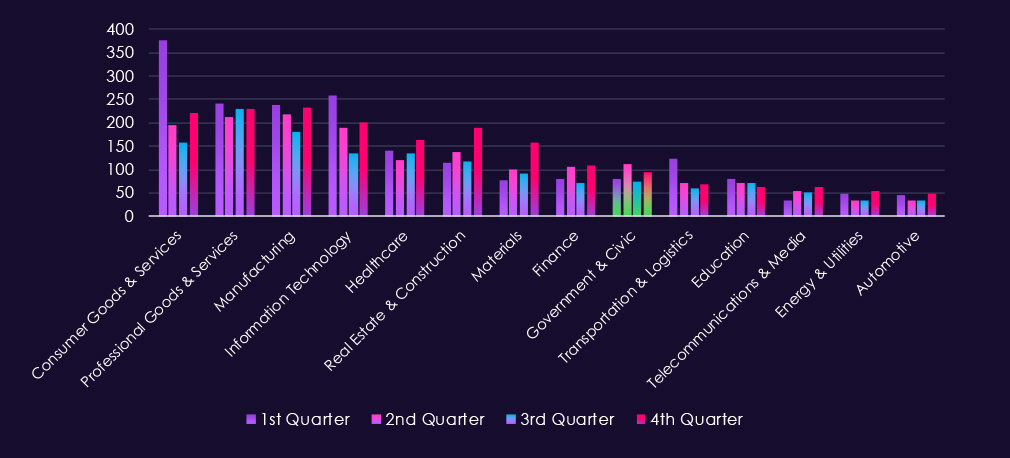
Bar chart above is focused only on 2025 and victims counts per quarters for clear and easy to see trends. Government & civic organizations show choppy alternating quarters. Q4 recording most victims and Q3 the least.
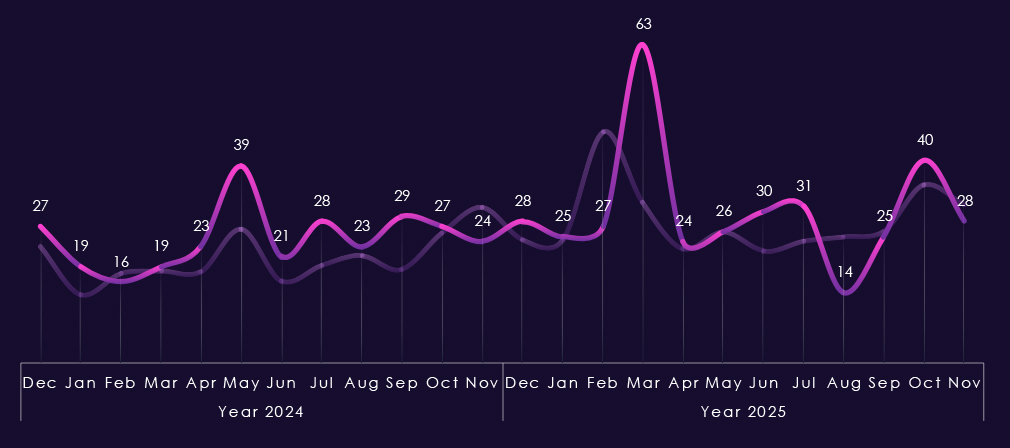
Monthly activity charted over scaled-down global all industries victims counts shows the first half of 2024 following the global trendline, including the May peak, which was significantly more pronounced. The rest of 2024 shows nearly perfectly inverted global peaks and dips.
In 2025, we can see the global February peak missing this sector, but having its own month later and more pronounced. From April to July, we see steady growth followed by a sharp dip in August and then an immediate peak towards October.
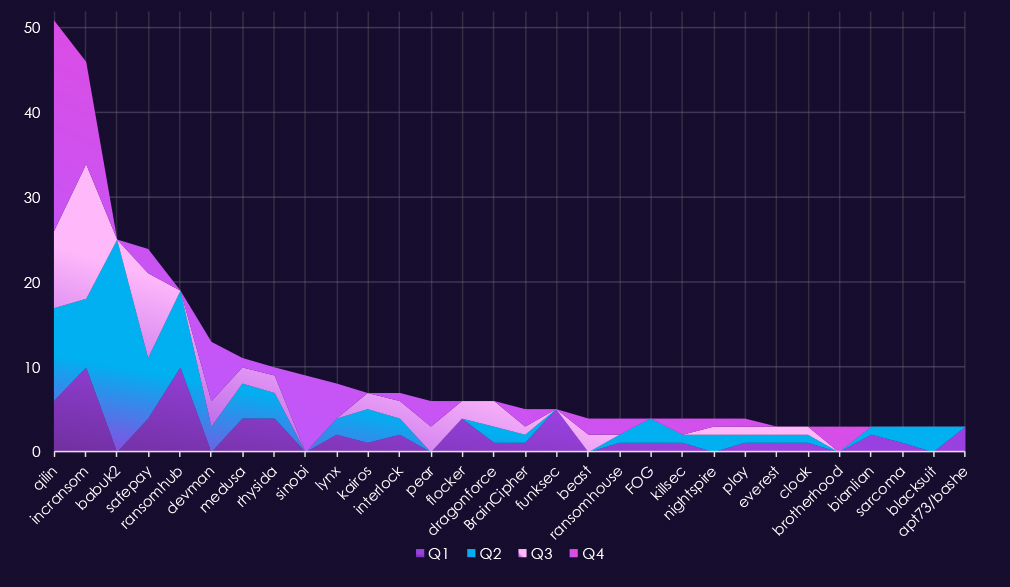
In total, 74 out of 124 gangs active in 2025 recorded victims in the government & civic organizations industry, that is 60% participation.
A breakdown of the top 30 gangs’ quarterly activity provides insights into which gangs were the most active each quarter. 2025 shows sustained pressure across the year, with several gangs maintaining consistent activity and notable surges driven by short-lived campaigns.
Q1 activity was relatively distributed. IncRansom (10) and RansomHub (10) led the quarter, followed by Qilin (6) and FunkSec (5). Most other gangs recorded low, single-digit activity, suggesting opportunistic targeting rather than coordinated campaigns early in the year.
In Q2, activity increased sharply and became more concentrated. Babuk2 (25) emerged as the most active gang by a wide margin, while Qilin (11), RansomHub (9), and IncRansom (8) maintained steady pressure. Several gangs appeared only in this quarter, indicating time-bound or campaign-driven activity.
Q3 saw a redistribution of activity. IncRansom (16) became the most active gang, followed by SafePay (10) and Qilin (9). A broader set of actors recorded modest activity, including DevMan, Pear, and DragonForce, contributing to a more dispersed threat landscape.
By Q4, activity intensified again. Qilin (25) clearly dominated the quarter, while IncRansom (12) and Sinobi (9) showed significant late-year increases. Several additional gangs recorded small but persistent activity, indicating continued interest in the sector despite shifting leadership.
Overall, government & civic organizations experienced consistent ransomware pressure throughout 2025, shaped by a mix of sustained actors such as Qilin and IncRansom and episodic surges from groups like Babuk2. The pattern reflects both ongoing targeting and short-term campaigns rather than dominance by a single actor across the full year.
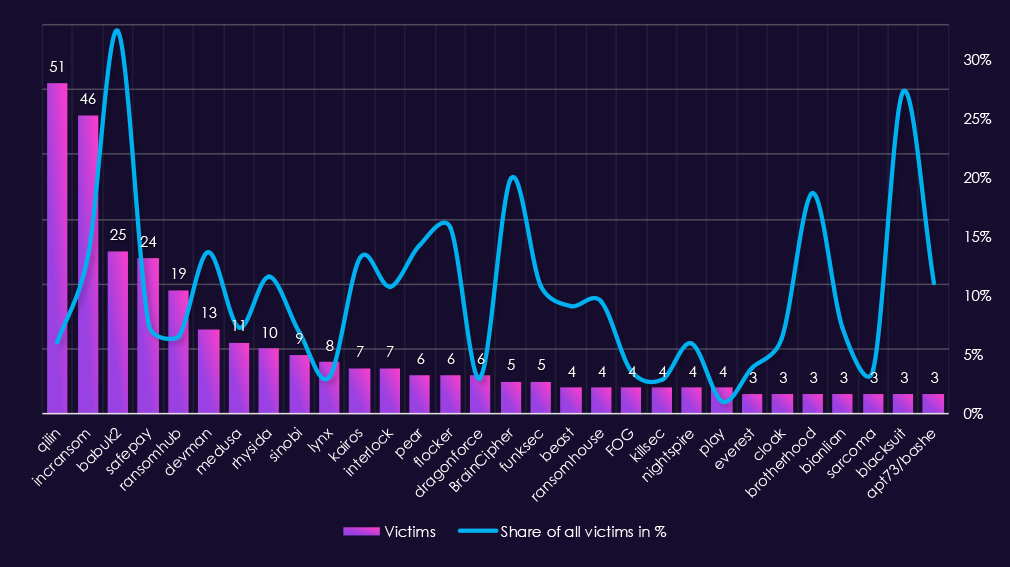
Another look at 2025 government & civic victim counts data alongside each of the top 30 gangs’ share of total victims shows a combination of sustained activity from several actors and a number of proportionally focused outliers driven by limited overall volumes.
By sector victim count, Qilin (51) and IncRansom (46) were the most active gangs. For Qilin, government and civic targets represent 6.0% of total victims, indicating broad targeting rather than sector specialization. In contrast, IncRansom (13.5%) combines high volume with elevated proportional exposure, suggesting this sector was a meaningful component of its activity. Babuk2 (25 victims, 32.5%) stands out with both notable volume and a high sector share, indicating a strong focus during its active period. However, we now know they were reposting old data leaks as ransomware victims.
Several gangs show relatively high proportional exposure (>10%). These include DevMan (13.7%), Kairos (13.2%), Interlock (10.8%), Pear (14.3%), Flocker (15.8%), BrainCipher (20.0%), Brotherhood (18.8%), Blacksuit (27.3%), and APT73/Bashe (11.1%). For many of these groups, government & civic organizations represent a significant share of overall activity.
Some of the high percentage values are driven by low overall victim counts. Groups such as Blacksuit or Brotherhood each recorded low sector victims, meaning small absolute changes inflate their percentage shares and should be interpreted cautiously.
Most remaining gangs fall into a low to moderate focus range (<10%), including RansomHub, SafePay, Medusa, Rhysida, Sinobi, Lynx, and DragonForce, indicating opportunistic or secondary targeting rather than sustained sector specialization.
Overall, government & civic organizations faced persistent ransomware pressure in 2025, with a mix of broad-based actors and a subset of gangs showing elevated proportional focus. As in other sectors, the most extreme percentage values largely reflect limited activity rather than long-running, large-scale campaigns.
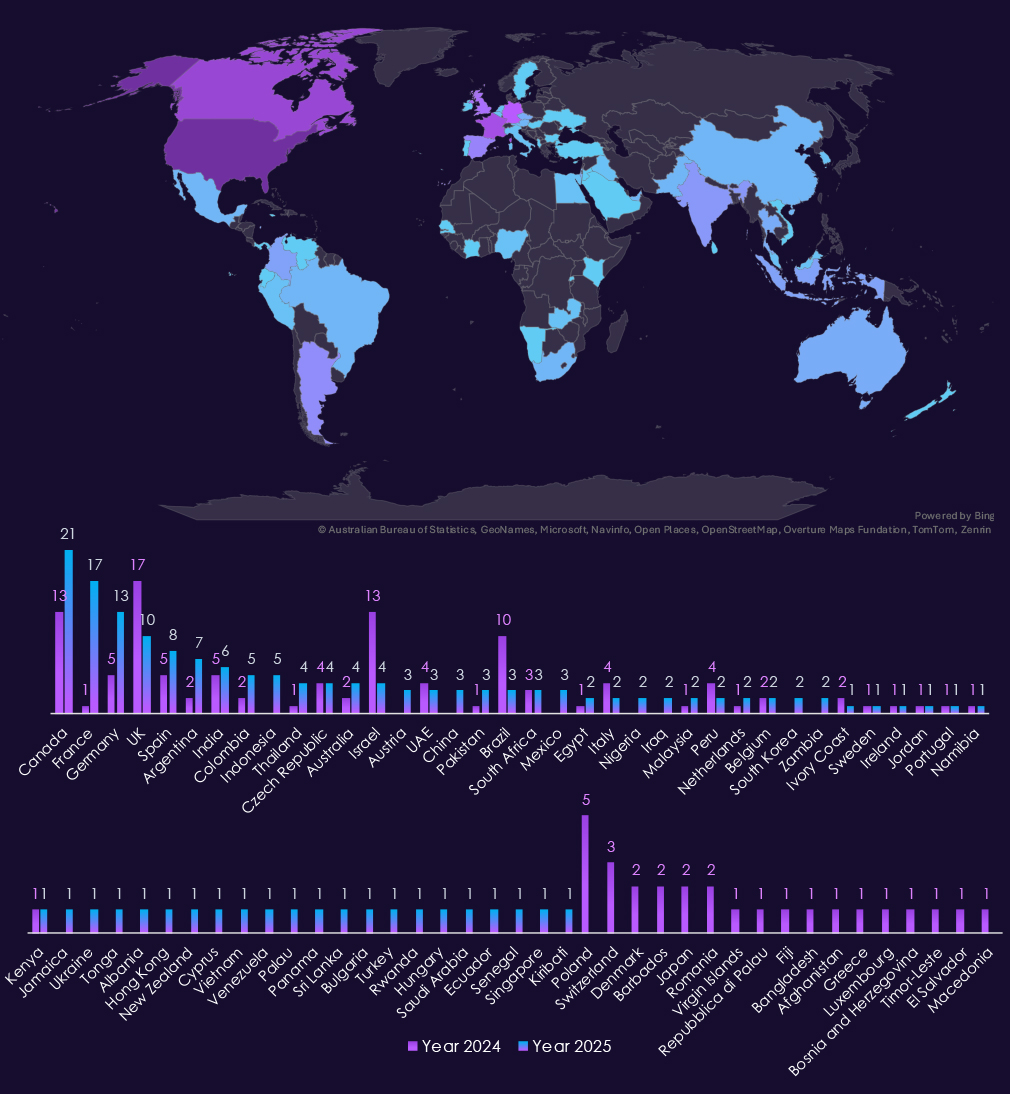
With 181 victims, the USA accounts for 50% of government & civic victims in 2025. The US also recorded an increase from 158 victims in 2024.
France is the biggest outlier, jumping from 1 to 17 victims. Canada, Germany, Spain, and Argentina were among the countries with the highest increases.
Israel, Brazil, and Poland, on the other hand, had the largest declines.
A total of 59 countries recorded victims in 2025, a sizeable increase from 47 in 2024.
Year-over-Year Risk Elevation: High

In 2025, government & civic organizations experienced very high APT exposure, with victims observed in 86% of tracked campaigns, marking a significant year-over-year increase. Activity was driven primarily by espionage-focused nation-state actors, reflecting the sector’s intelligence value, policy relevance, and geopolitical importance, while financially motivated actors continued to apply ransomware and access-monetization pressure. Targeting was globally distributed, aligned with politically and economically significant states rather than isolated regions.
Attack activity continued to originate primarily from web applications, reflecting reliance on public-facing services, internal portals, and inter-agency platforms. Compared to 2024, 2025 showed greater emphasis on operating systems and core backend platforms, alongside databases, application infrastructure, network monitoring tools, and selected remote access technologies. This progression indicates movement from initial compromise into long-term persistence, internal visibility, and lateral movement, consistent with sustained intelligence collection and follow-on exploitation.
Underground and dark web chatter increased sharply from 2024 into 2025, dominated by data breaches and data leaks, with ransomware-related discussion rising significantly alongside continued hacktivist and DDoS activity tied to geopolitical events. Web exploit chatter also expanded, reinforcing the role of exposed government-facing applications as a primary access vector. Overall activity reflects a blend of espionage fallout, financial crime, and ideologically driven disruption.
Ransomware victimization increased 22% year over year, continuing a multi-year upward trend, though the sector’s overall share of global ransomware activity remained moderate. Pressure was consistent across the year, shaped by a mix of sustained actors and short-lived campaigns rather than dominance by a single group. Participation was broad, with 60% of active ransomware gangs recording victims. The United States accounted for half of all victims, while geographic exposure expanded further, reinforcing government & civic organizations as a persistently targeted, high-impact sector entering 2026.
Over the past 12 months, educational organizations recorded victims in just 2 of the 43 Advanced Persistent Threat (APT) campaigns observed. That is a presence in 5% of all campaigns and an increase from a single campaign in the previous year.

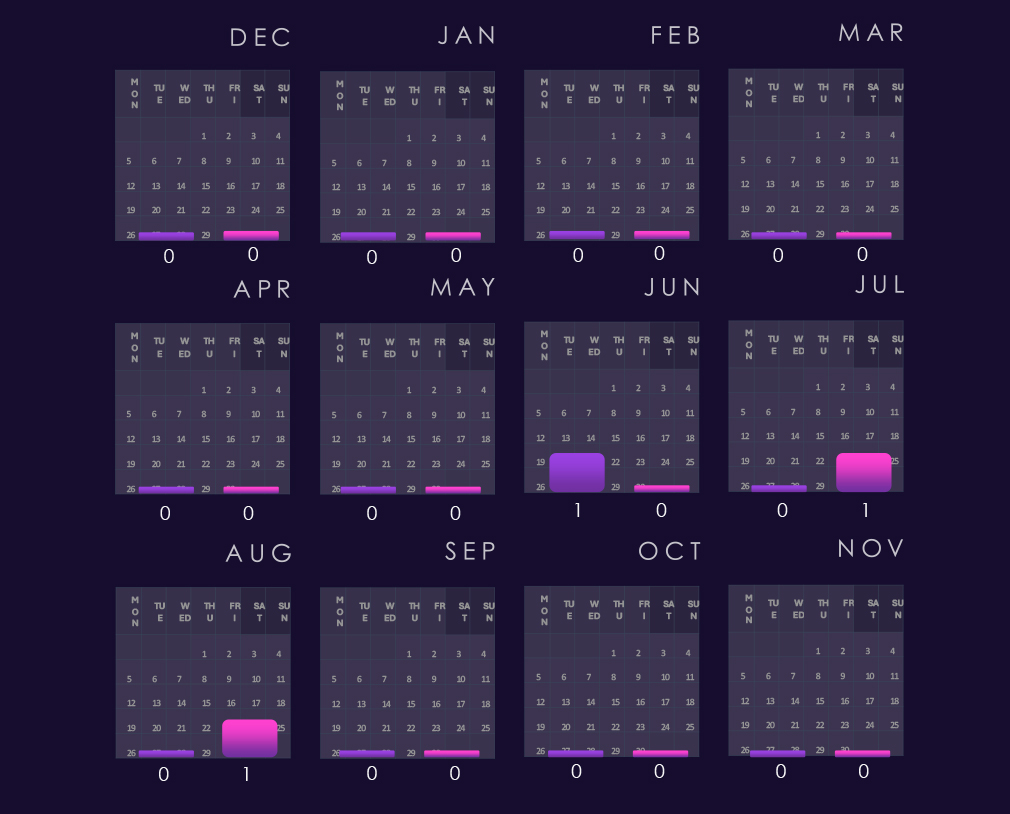
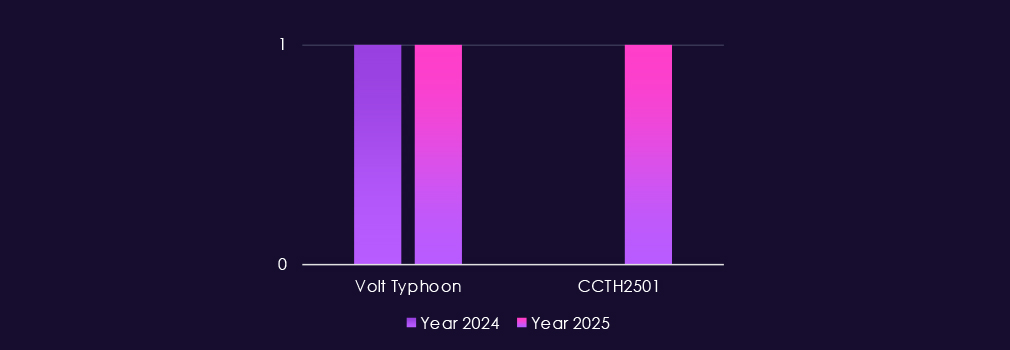
In 2025, activity includes Volt Typhoon, indicating interest in academic and research environments that often intersect with government, defense, and advanced technology ecosystems. An additional 2025 campaign attributed to Turkish-speaking cybercrime group CCTH2501 suggests opportunistic targeting for profit.
In 2024, the sector saw one recorded campaign, also linked to Volt Typhoon.

In 2024, activity is limited to a single observed campaign, resulting in one victim per country across the United States, Japan, the United Kingdom, Australia, and India. The geographic spread does not indicate sustained regional focus and instead reflects selective targeting within one operation.
In 2025, only two campaigns are observed. These account for the wider but still shallow distribution of victims across Asia-Pacific, the Middle East, Europe, and North America. Japan appears in both campaigns, while all other countries show single-instance exposure tied to one campaign or the other.
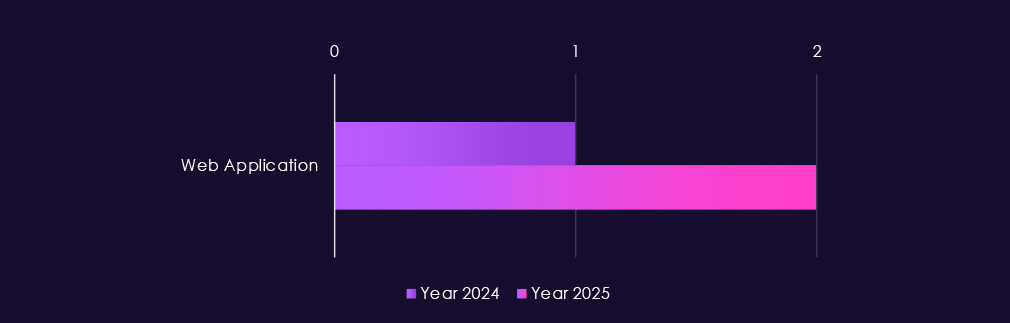
In 2024, the single observed campaign targeted a web application, consistent with opportunistic access to externally facing academic portals or research-related systems rather than deep network or endpoint compromise.
In 2025, both observed campaigns again focus on web applications, accounting for the two recorded instances. No operating system, network, or infrastructure-layer technologies appear in the data, suggesting that activity remains lightweight, access-focused, and narrowly scoped.

Over the past 23 months, CYFIRMA’s telemetry has identified 25,285 hits for educational organizations topics. This is from a total of 2.5 million posts across various underground and dark web channels and forums.
The chart above shows total counts of industry-linked mentions for educational organizations and individual categories of context for the mentions.The chart below shows year-over-year growth for each category in this industry.
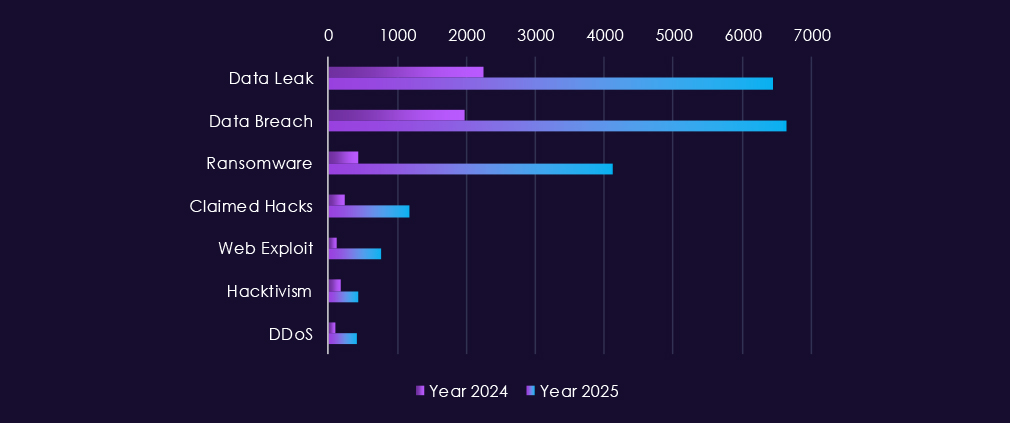
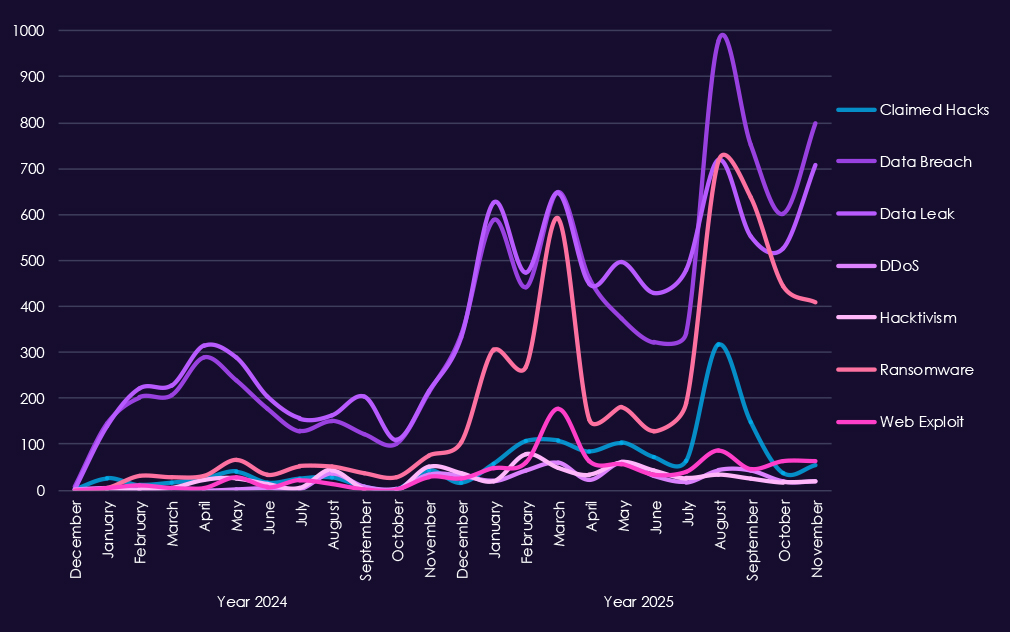
Underground & dark web chatter related to the education sector remains active across both years, but the volume and composition of activity indicate that this industry is primarily treated as a soft, opportunistic target rather than a focus for sustained or highly specialized campaigns.
In 2024, activity is steady but uneven. Data breach and data leak discussions dominate throughout the year, reflecting continued exposure of student records, research data, and credential repositories. Claimed hacks and ransomware mentions appear regularly but at relatively modest levels, suggesting smaller-scale incidents rather than coordinated campaigns. Spikes in hacktivism and DDoS chatter occur intermittently, often aligning with geopolitical or social flashpoints rather than sector-specific motivations.
In 2025, chatter increases sharply across nearly all categories. Data breach and data leak postings rise significantly and remain consistently high, indicating growing monetization of academic data sets and institutional access. Ransomware-related chatter shows the most pronounced growth, particularly mid-to-late year, pointing to increased targeting of universities and educational providers with limited incident response capacity. Claimed hacks and web exploit discussions also rise, reinforcing the view that attackers favor straightforward intrusion methods against exposed portals and legacy systems.
DDoS and hacktivism continue to appear frequently but remain secondary compared to financially motivated activity. Their presence suggests educational institutions are still used as visible but low-risk targets for disruption or signaling rather than as strategic objectives.
Overall, the chatter profile reflects a sector that is highly visible, data-rich, and operationally constrained, making it attractive for ransomware crews and data brokers, while remaining less central to advanced, long-term intrusion efforts compared to government or critical infrastructure industries.

Over the past 23 months, CYFIRMA’s telemetry has identified 1,352 education sector-linked mentions. This is from over 90k CVEs reported and updated in the same time period.
The chart above shows total counts of industry-linked mentions for educational technology and individual categories of reported vulnerabilities.The chart below shows year-over-year growth for each category in this industry.
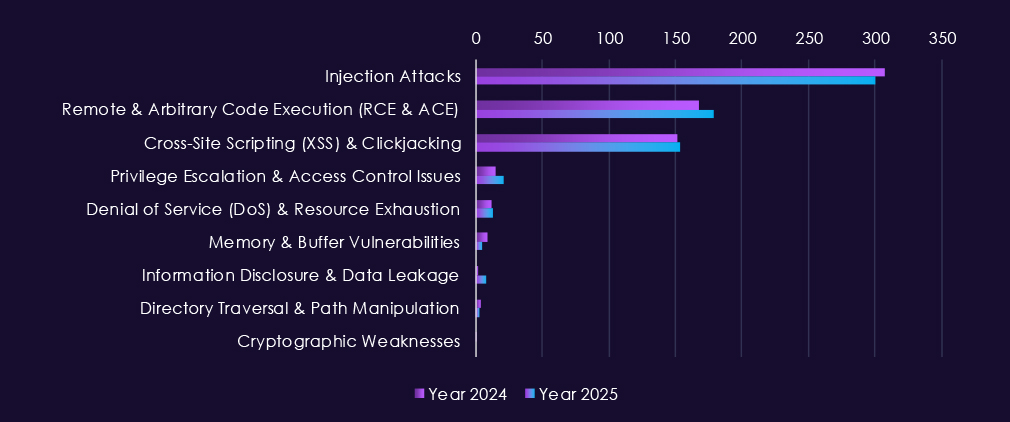

Reported CVEs affecting educational technology show a clear and consistent emphasis on web-facing, high-exposure flaws, reflecting the sector’s heavy reliance on online learning platforms, student portals, and third-party academic systems.
Across 2024, injection attacks dominate the CVE landscape, with repeated spikes throughout the year. This highlights persistent weaknesses in learning management systems, admissions portals, and research platforms that process user-supplied data at scale. Remote and arbitrary code execution (RCE/ACE) vulnerabilities also appear regularly, indicating ongoing risk of direct system compromise where patching and lifecycle management lag behind commercial standards. XSS and clickjacking remain common, reinforcing that client-facing applications continue to be a primary attack surface.
In 2025, the overall CVE volume increases and becomes more sustained. Injection attacks and RCE/ACE again lead, but with higher monthly consistency, suggesting both increased discovery and active exploitation focus. XSS remains prevalent, particularly in complex multi-user platforms, while smaller but recurring instances of privilege escalation and access control issues point to post-exploitation and lateral movement potential once initial access is obtained.
Denial-of-service vulnerabilities and memory-related flaws appear sporadically in both years, but at lower volumes, aligning with the sector’s limited use of bespoke infrastructure and greater dependence on shared software stacks. Information disclosure and directory traversal issues surface occasionally, indicating secondary risks tied to misconfigurations rather than novel exploit development.
Overall, the CVE profile reflects an educational sector where application-layer security is the dominant risk, with large attack surfaces, diverse user populations, and uneven patch management.
In the past 12 months, CYFIRMA has identified 287 verified educational organizations as ransomware victims. This is a 23% increase from 233 victims in the previous year, which recorded a dip from 273 victims during 2023.
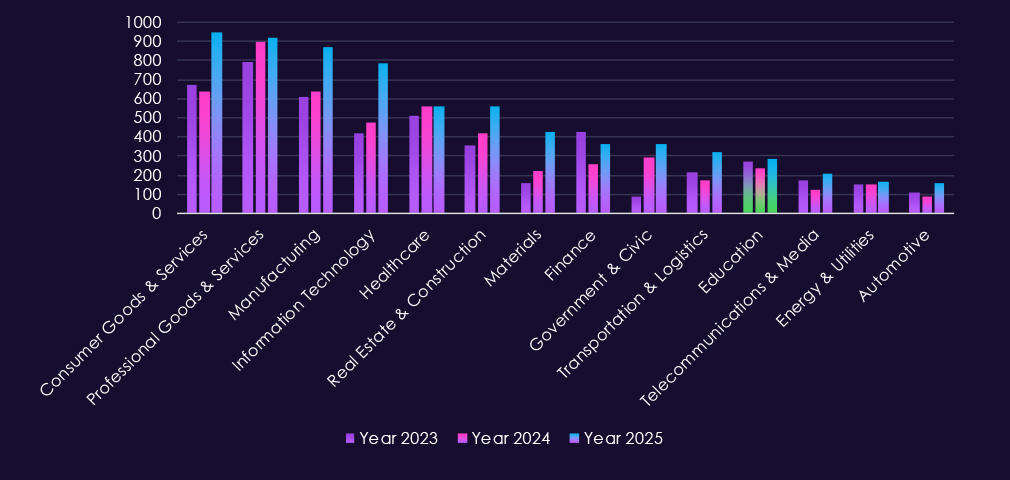
Educational organizations accounts for 4.1% of the overall total of 7,099 ransomware victims during the same period. That is decline from 4.46% in previous year, and even less than 5.45%. Showing that despite a higher number of victims, educational organizations are less popular target. Total number grows due to growing volume of ransomware in general.
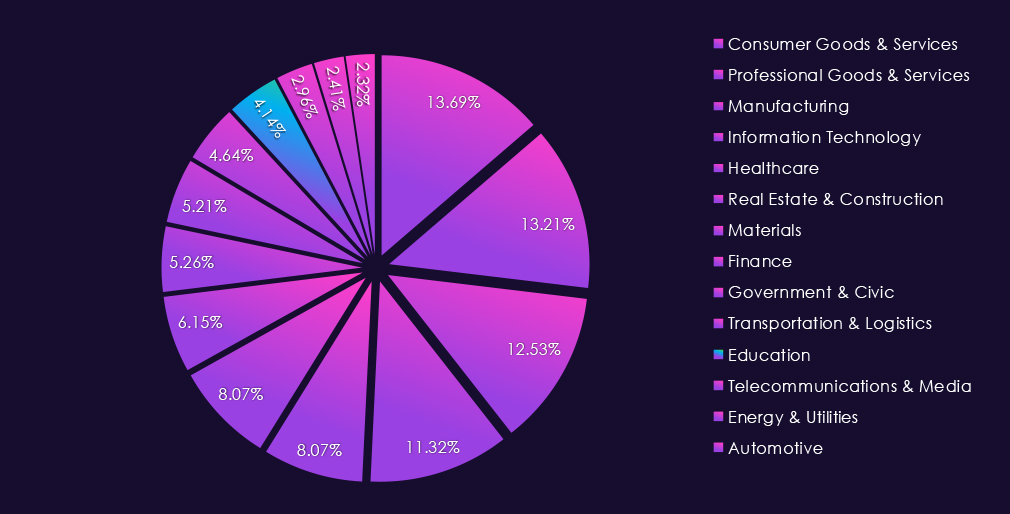
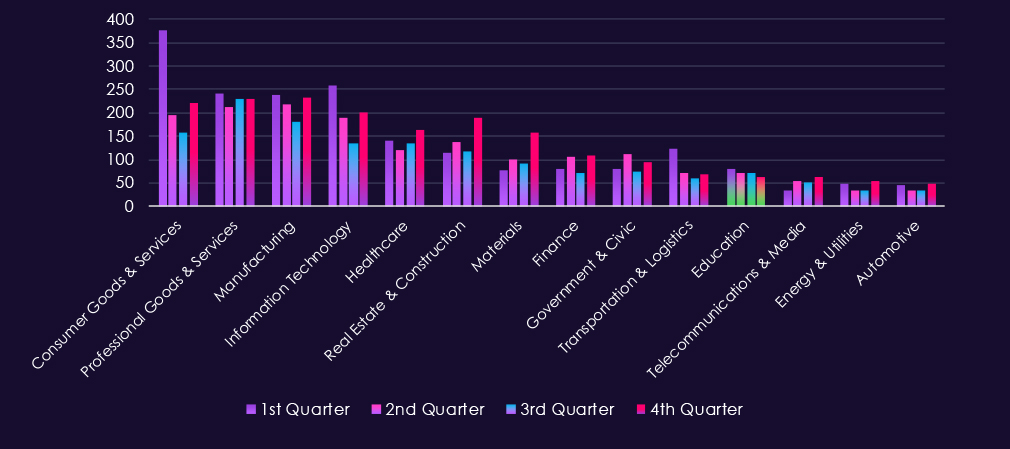
Bar chart above is focused only on 2025 and victims counts per quarters for clear and easy to see trends. Educational organizations shows mild gradual decline from Q1 all the way to Q4.
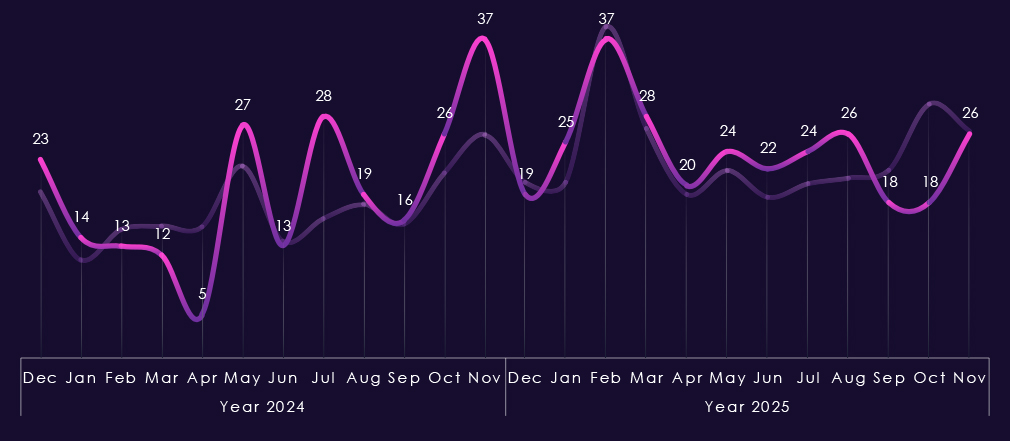
Monthly activity charted over scaled-down global all industries victims counts shows activity in 2024 deviating significantly from the global trendline on multiple occasions. The most prominent is the dip in April and peaks in July and November.
Through 2025, we can see more close alignment with the global trendline. From May, there is a minor divergence upwards, that keeps slowly growing until August and then a sharp dip redirects the divergence below the global trendline until November where both lines match again.
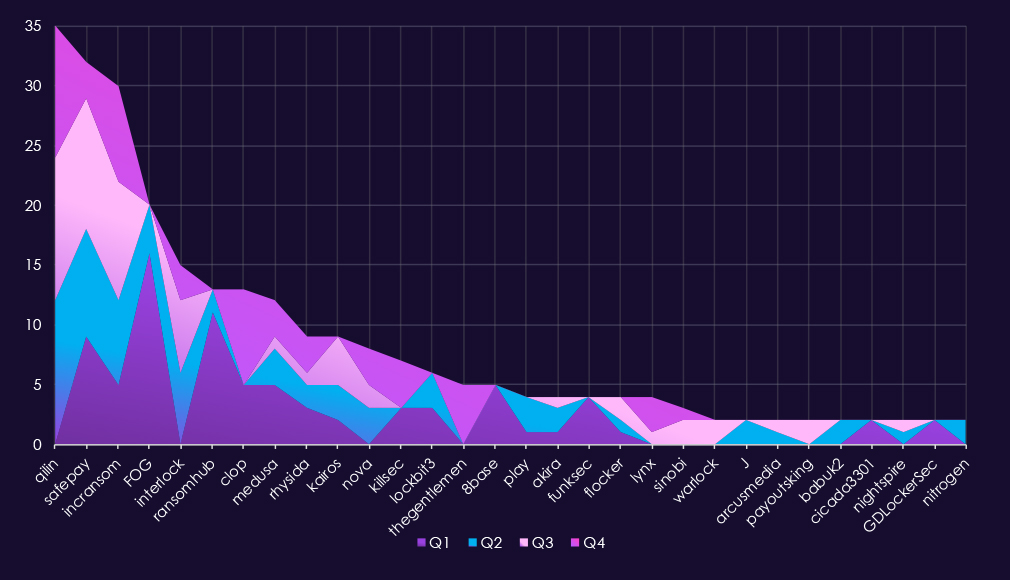
In total 54 out of 124 gangs recorded victims in healthcare industry, 44% participation.
A review of quarterly top 30 ransomware gangs’ activity against educational organizations in 2025 shows uneven pressure across the year, with early concentration among a small number of actors and more distributed activity in the second half.
Q1 activity was led by FOG (16), followed by RansomHub (11) and SafePay (9). Most other gangs recorded low, single-digit activity, indicating a relatively concentrated early-year threat environment driven by a handful of actors.
In Q2, activity shifted noticeably. Qilin (12) emerged as the most active gang, while SafePay (9) and IncRansom (7) maintained consistent pressure. Interlock (6) also increased activity, and several additional groups appeared at low volume, broadening the threat landscape.
Q3 activity remained steady but more evenly distributed. Qilin (12) and SafePay (11) continued to lead, closely followed by IncRansom (10). A wider set of gangs recorded two to four incidents, suggesting sustained but lower-intensity targeting across multiple actors rather than a single dominant campaign.
By Q4, activity declined slightly overall but remained persistent. Qilin (11) and IncRansom (8) led the quarter, while Clop (8) re-emerged after minimal activity earlier in the year. Several smaller groups recorded isolated incidents, contributing to a longer tail of low-volume activity.
Overall, educational organizations experienced consistent ransomware targeting in 2025, without the extreme surges seen in some other sectors. Most activity was driven primarily by a small group of recurring actors, with shifts in leadership across quarters and a steady background of opportunistic targeting rather than sustained dominance by any single gang.
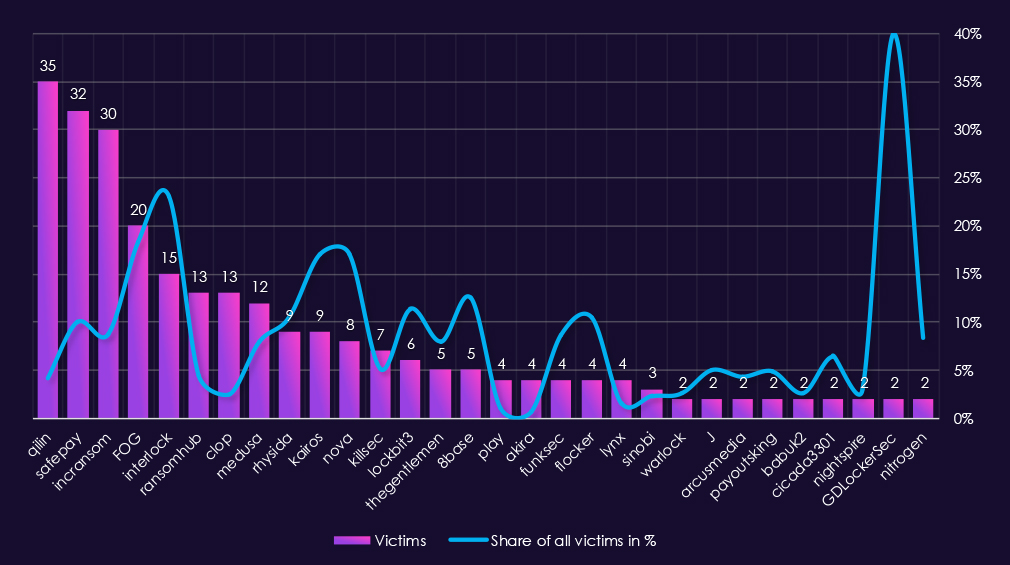
Reviewing 2025, educational organization victims counts alongside each of the top 30 gangs’ share of total victims shows moderate absolute exposure and a mix of broadly active actors and proportionally focused outliers.
By sector victim count, Qilin (35), SafePay (32), and IncRansom (30) were the most active gangs. For Qilin, educational organizations represents only 4.1% of total victims, indicating broad targeting rather than sector specialization. SafePay (10.0%) and IncRansom (8.8%) show higher proportional exposure, suggesting educational organizations were a more meaningful but still secondary target.
Several gangs show relatively high proportional exposure (>10%). These include FOG (18.3%), Interlock (23.1%), Rhysida (10.5%), Kairos (17.0%), Nova (17.0%), LockBit3 (11.3%), 8Base (12.5%), and Flocker (10.5%), indicating educational organizations accounted for a significant share of activity for these groups.
A small number of extreme percentage values are driven by very low overall victim counts. GDLockerSec (40.0%) is the clearest outlier, reflecting two educational organization victims against a minimal total victim pool. Similar skew is visible for Interlock, Kairos, and Nova, where limited absolute volumes inflate sector share and should be interpreted cautiously.
Most remaining gangs fall into a low to moderate focus range (<10%), including RansomHub, Clop, Medusa, KillSec, TheGentlemen, and FunkSec, indicating educational organizations were often a secondary or opportunistic target.
Overall, no single gang is showing dominant sector specialization. Elevated percentage values are largely influenced by small victim counts, while the most active gangs generally maintain broad, multi-sector targeting strategies.

With 164 victims the USA accounts for 57% of all educational organization victims in 2025. The US also recorded an increase from 139 victims in 2024.
The UK, Canada, Germany, Australia, Taiwan or El Salvador were among countries with highest increases.
Israel, Turkey and Luxembourg on other hand saw biggest declines.
A total of 41 countries recorded victims in 2025, small increase from 39 in 2024.
Year-over-Year Risk Elevation: Moderate

In 2025, educational organizations experienced very limited APT exposure, with victims observed in 5% of tracked campaigns, a slight increase from 2024 but still indicating low prioritization by advanced threat actors. Observed activity remained narrow in scope, driven by isolated espionage-linked interest in academic and research environments and opportunistic cybercrime rather than sustained, multi-campaign targeting. Geographic distribution was broad but shallow, with most countries appearing only once per campaign.
Attack activity in both 2024 and 2025 focused exclusively on web applications, reflecting reliance on externally exposed academic portals, learning management systems, and research platforms. No meaningful progression into operating systems, network infrastructure, or backend environments was observed, indicating lightweight, access-oriented intrusion rather than persistence-focused campaigns.
In contrast, underground and dark web chatter increased sharply in 2025, dominated by data breaches, data leaks, and rising ransomware-related discussions. This divergence suggests that while educational organizations remains a low-priority APT target, it is increasingly treated as a soft target for monetization, with attackers exploiting limited security resources, large user populations, and valuable personal and research data. Hacktivism and DDoS activity remained visible but secondary, often tied to short-lived social or geopolitical events.
Ransomware victimization increased 23% year over year, though the sector’s share of global ransomware activity declined, reflecting faster growth in other industries. Targeting remained moderate and uneven, driven by a small set of recurring actors alongside opportunistic campaigns rather than sustained sector focus. The United States accounted for over half of all victims, while overall geographic exposure remained limited, reinforcing educational organizations as a data-rich but strategically secondary target entering 2026.