
The CYFIRMA Industry Report delivers original cybersecurity insights and telemetry-driven statistics of global industries, covering one sector each week for a quarter. This report focuses on the information technology industry, presenting key trends and statistics in an engaging infographic format.
Welcome to the CYFIRMA infographic industry report, where we delve into the external threat landscape of the information technology industry over the past three months. This report provides valuable insights and data-driven statistics, delivering a concise analysis of attack campaigns, phishing telemetry, and ransomware incidents targeting information technology organizations.
We aim to present an industry-specific overview in a convenient, engaging, and informative format. Leveraging our cutting-edge platform telemetry and the expertise of our analysts, we bring you actionable intelligence to stay ahead in the cybersecurity landscape.
CYFIRMA provides cyber threat intelligence and external threat landscape management platforms, DeCYFIR and DeTCT, which utilize artificial intelligence and machine learning to ingest and process relevant data, complemented by manual CTI research.
For the purpose of these reports, we leverage the following data from our platform. These are data processed by AI and ML automation based on both human research input and automated ingestions.
While this report contains statistics and graphs generated primarily by automation, it undergoes thorough review and enhancement for additional context by CYFIRMA CTI analysts to ensure the highest quality and provide valuable insights.
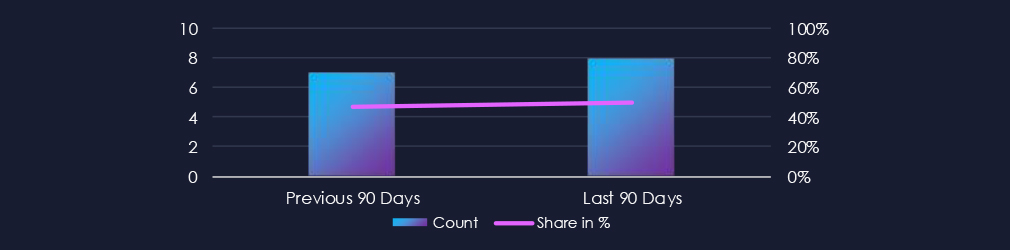
Over the past 90 days, the information technology industry featured in 8 out of the 16 observed campaigns, which is a presence in 50% of all campaigns. That is remarkably consistent with the previous 90-day period, where 7 out of 15 campaigns recorded victims in this industry.

Most campaigns were observed during September, then new detections declined. However most of campaigns still continue on into December.
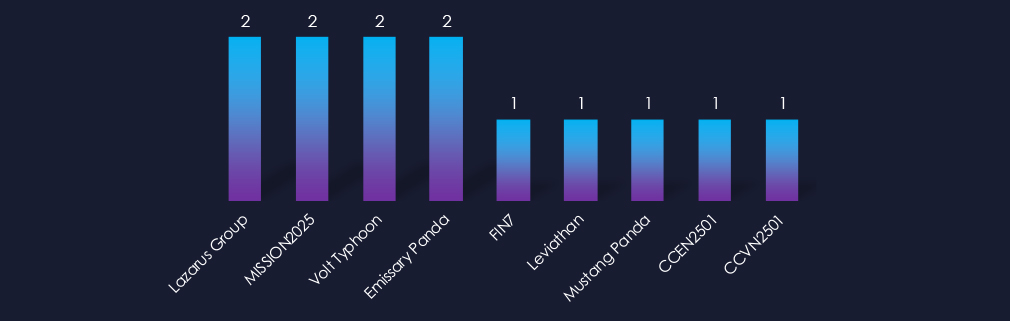
Active threat actors come mostly from China. The North Korean Lazarus Group recorded two campaigns, the Russian cybercrime syndicate FIN7, one, and then we observed English- and Vietnamese-speaking cybercriminals (CCEN250, CCVN2501) also recording victims in this industry.
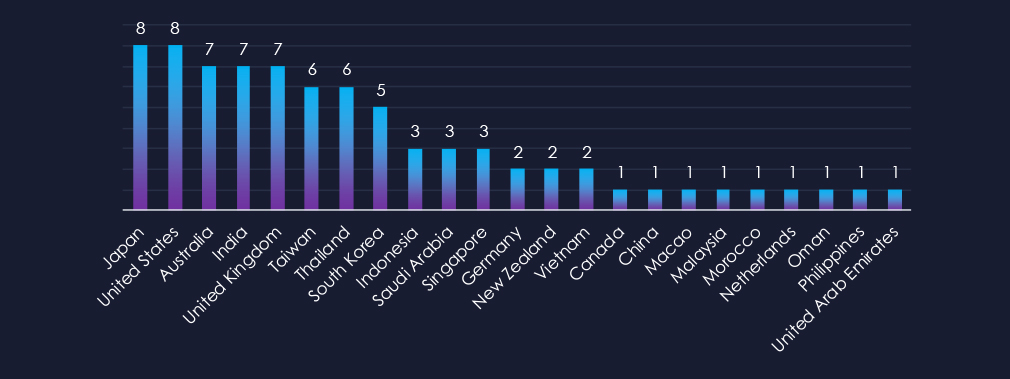
Japan and the US are leading the chart with presence in 8 out of 8 observed campaigns. At shared second place are Australia, India, and the UK. Taiwan and Thailand share third place.
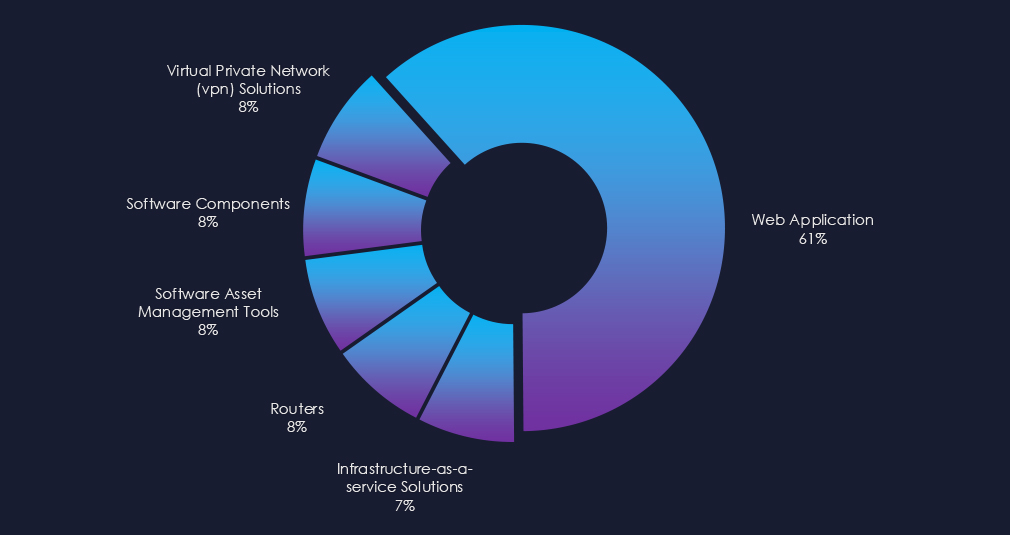
8 out of 8 campaigns used Web Application as the primary attack vector. Additionally, various network, management, VPN, and infrastructure software were observed.

Over the past 90 days, the information technology industry has been significantly affected by advanced persistent threat (APT) campaigns.
Out of the 16 observed APT campaigns, 8 targeted this industry, representing 50% of the observed campaigns. This is sustained activity from the previous 90-day period, during which 7 out of 15 campaigns targeted this industry.
Monthly Trends
Key Threat Actors
Active threat actors originate mostly from China. Examples include Volt Typhoon, Emissary, and Stone Panda. Furthermore, we observe North Korean Lazarus Group, Russian FIN7, Vietnamese, and English-speaking cybercriminals.
Geographical Impact
Overall, 23 countries recorded victims in observed campaigns. Japan and the US lead the chart with their presence in eight out of eight observed campaigns. Australia, India, and the UK are in second place, while Taiwan and Thailand share third place.
Targeted Technologies
Eight out of eight campaigns employed Web Applications as their primary attack vectors. Campaigns also targeted various network, management, VPN, and infrastructure software solutions.
Over the past three months, CYFIRMA’s telemetry has identified 17,513 mentions of the information technology industry out of a total of 97,925 industry mentions. This is from a total of 300k+ posts across various underground and dark web channels and forums.
The information technology industry placed 1st out of 14 industries in the last 90 days with a share of 17.9% of all detected industry-linked chatter.
Below is a breakdown by 30-day periods of all mentions.
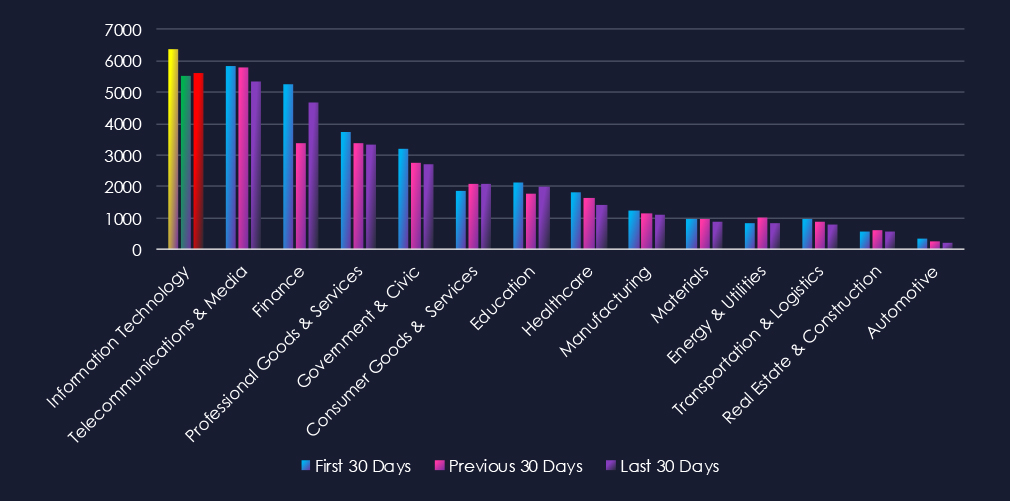
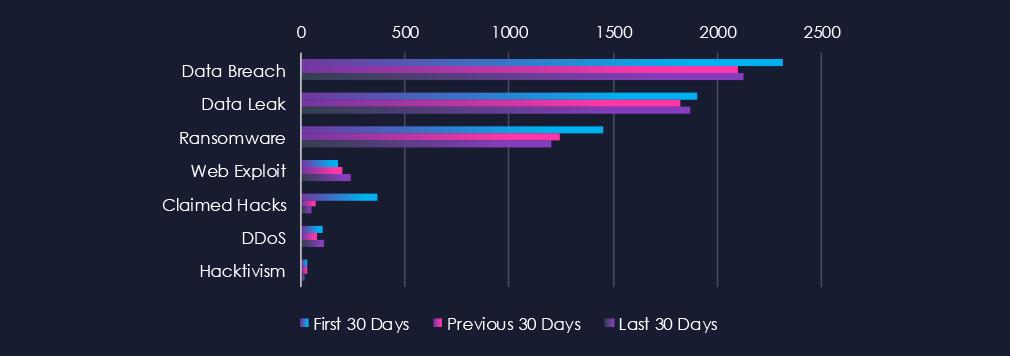
Data Leaks and Data Breaches remain the most common category of recorded chatter for this industry and are showing high sustained interest. Ransomware chatter was also high and mildly declined after a surge in the first 30 days.

In total, information technology industry comprise 17.9% of all detected industry underground and dark web chatter in the last 90 days. And ranking 1st out of 14 industries. Below are observed key trends across 90 days:
Data Breach
2318 → 2103 → 2127, Extremely high and largely stable. IT vendors, MSPs, cloud providers, and software companies remain prime targets due to their access to downstream clients and high-value intellectual property.
Data Leak
1903 → 1824 → 1873, Mirrors the breach pattern: consistently elevated with slight fluctuations. Indicates ongoing resale or exposure of source code, customer datasets, credentials, and API tokens, often harvested from compromised IT suppliers.
Ransomware
1453 → 1241 → 1203, High but gradually trending downward. This suggests a small reduction in ransomware chatter, yet IT organizations remain disproportionately targeted due to their role as attack multipliers via supply-chain compromise.
Web Exploit
179 → 196 → 239, A clear rising trajectory. Reflects increasing exploitation attempts against public-facing IT infrastructure, SaaS platforms, and developer tooling, often tied to newly disclosed CVEs or misconfigurations.
Claimed Hacks
368 → 69 → 47, Massive drop after an unusually high first period. The early spike likely represented a series of high-profile claims, followed by a shift toward less public, more monetized underground activity such as access sales.
DDoS
106 → 76 → 111, Fluctuating but still notable. The latest increase suggests a resurgence in targeted disruption attacks against data centres, hosting providers, and technology platforms.
Hacktivism
31 → 28 → 18, Gradual decline. Indicates that ideologically driven operations against IT providers have slowed, with financially driven actors dominating the threat landscape.
Over the past three months, CYFIRMA’s telemetry has identified 1,168 mentions of the information technology industry out of a total of 2,968 industry mentions. This is from over 10k CVEs reported and updated in the last 90 days.
The information technology industry ranked 1st out of 14 industries in the last 90 days, with a share of 39.4% of all detected industry-linked vulnerabilities.
Below is a breakdown by 30-day periods of all mentions.
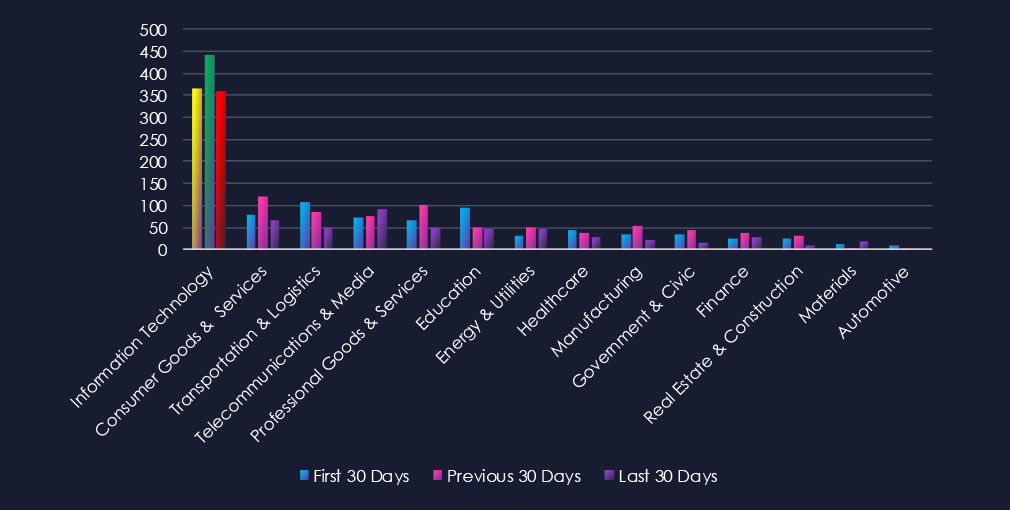
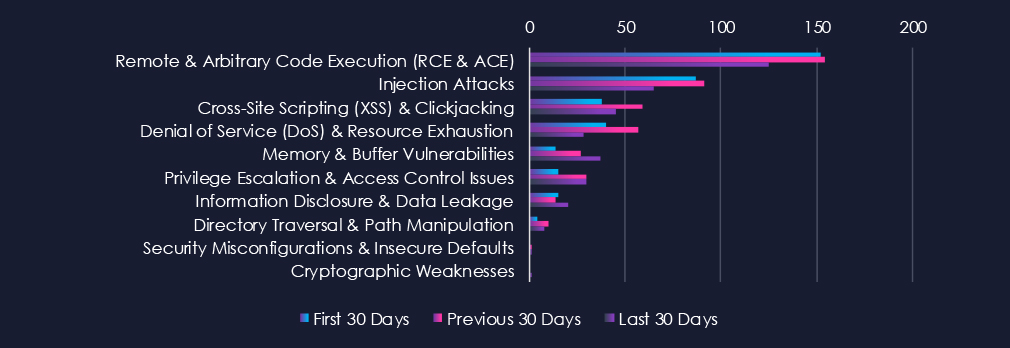
Remote & Arbitrary Code Execution (RCE & ACE) and Injection Attack are leading the chart with a decline over the last 30 days. XSS & Clickjacking with DoS & Resource Exhaustion are in third and fourth place, both recording upticks in the previous 30 days.

In total, the information technology industry comprises 39.4% of all detected industry-linked vulnerabilities in the last 90 days. And ranking 1st out of 14 industries. Below are observed key trends across 90 days.
Remote & Arbitrary Code Execution (RCE & ACE), 152 → 154 → 125
Very high across all periods, with a slight decline recently. RCE continues to dominate disclosure activity in IT due to the sector’s complex software stacks, cloud platforms, and widely deployed services.
Injection Attacks, 87 → 91 → 65
Elevated but trending downward. Indicates fewer newly discovered injection flaws in IT applications and APIs, though this class remains pervasive.
Cross-Site Scripting (XSS) & Clickjacking, 38 → 59 → 45
Spike followed by a moderate decrease. Many of these disclosures likely stem from web app audits, developer platforms, or customer portals.
Denial of Service (DoS) & Resource Exhaustion, 40 → 57 → 28
A sharp drop in the latest period. Suggests reduced focus on availability-related issues in IT infrastructure during this window, with attention shifting to memory and logic flaws.
Memory & Buffer Vulnerabilities, 14 → 27 → 37
Significant and accelerating growth. This aligns with increased scrutiny of libraries, dependencies, runtime engines, and legacy components widely used across IT environments.
Privilege Escalation & Access Control Issues, 15 → 30 → 30
Elevated and sustained. Reflects ongoing discovery of authentication /authorization flaws in identity systems, cloud platforms, and dev tools.
Information Disclosure & Data Leakage, 15 → 14 → 20
Recent increase after two stable periods. Indicates more findings where sensitive metadata, internal logs, or configuration information could be exposed.
Directory Traversal & Path Manipulation, 4 → 10 → 8
Higher than typical for IT, but now slightly declining. Common in web servers, CI/CD tools, and storage services.
Security Misconfigurations & Insecure Defaults, 0 → 1 → 1
Minimal but present, often tied to default credentials or unsafe initial configurations.
Cryptographic Weaknesses, 0 → 0 → 1
Rare but important when they appear, typically tied to flawed encryption implementation or insecure key handling.
In the past 90 days, CYFIRMA has identified 196 verified ransomware victims in the information technology industry. This accounts for 10.2% of the overall total of 1,915 ransomware victims during the same period, placing the IT industry 4th out of 14 industries.
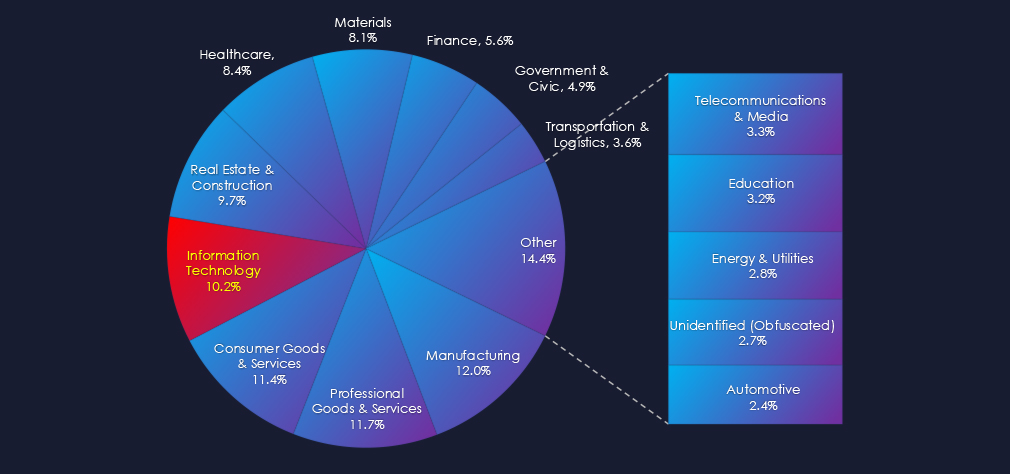
Furthermore, a quarterly comparison reveals a major increase in victims in the IT industry of 46.3% from 134 to 196 victims. The overall share of victims also grew from 9.12% to 10.23% of all victims.
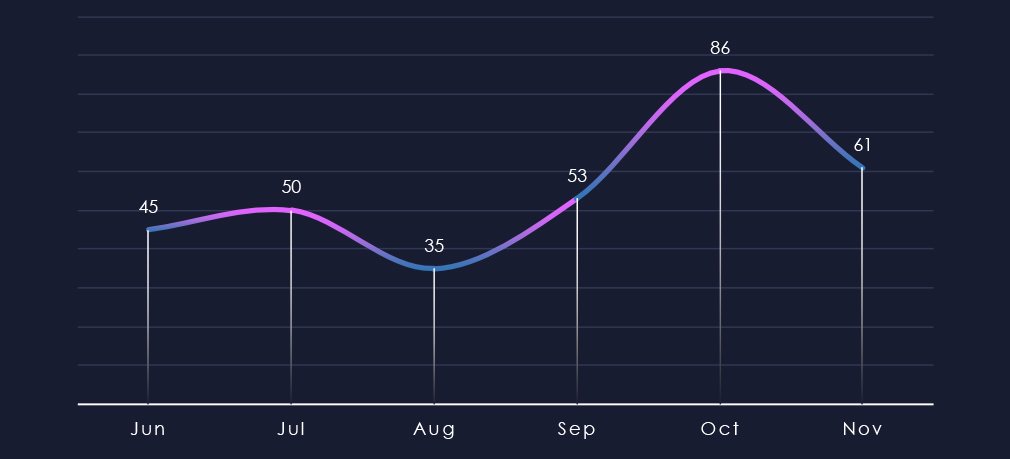
In the 180-day trendline, we can see the first 4 months being relatively stable with a minor dip during August. The number of victims spiked during October and remained elevated during November.
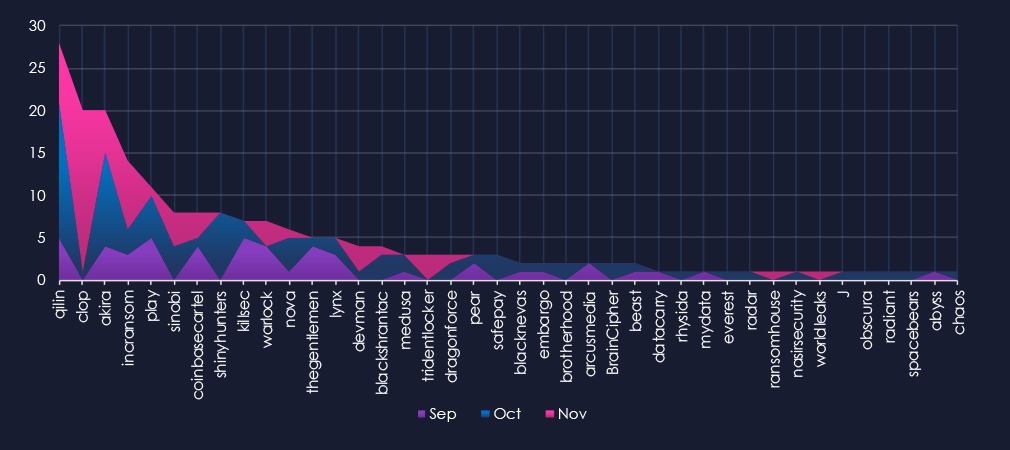
A breakdown of monthly activity per gang provides insights into which gangs were active each month. For example, the most active gang, Qilin, was active across months with a spike during October. On the other hand, the second most active gang, Cl0p, recorded a high number of victims in November. Akira and Shinyhunters contributed to the October spike.
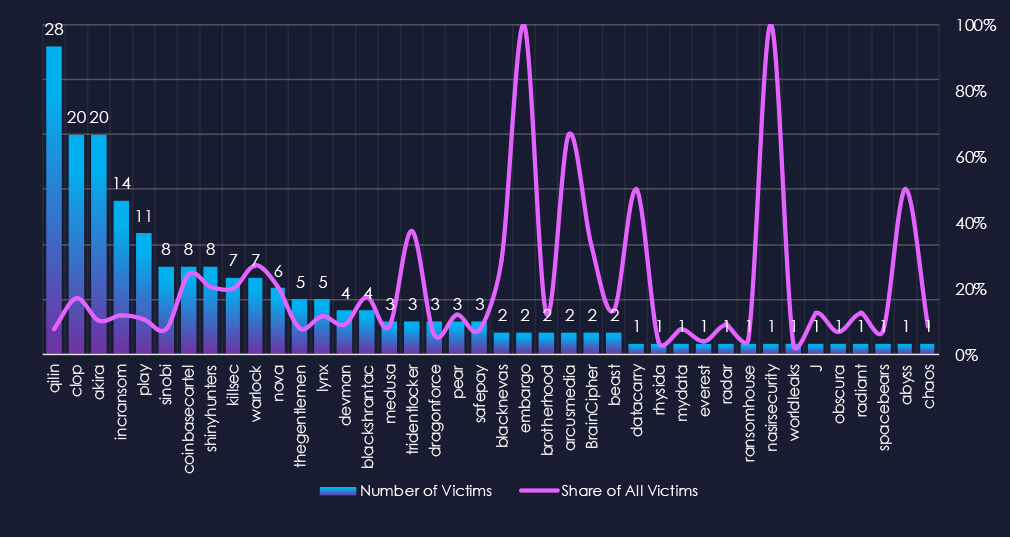
Out of the 70 gangs, 40 recorded victims in this industry in the last 90 days (57% participation). Qilin had the highest number of victims (28) with a 7.8% share of all their victims (28 out of 369). Their top position is due to the sheer number of victims.
The share of victims for most gangs in this industry is relatively high. Many gangs are reaching over 20% of their victims from the IT industry.
Cl0p (17%, 20 out of 117), Coinbasecartel (24%), and Warlock (27%) are some top gangs with the highest share of victims, implying a high focus on this industry.
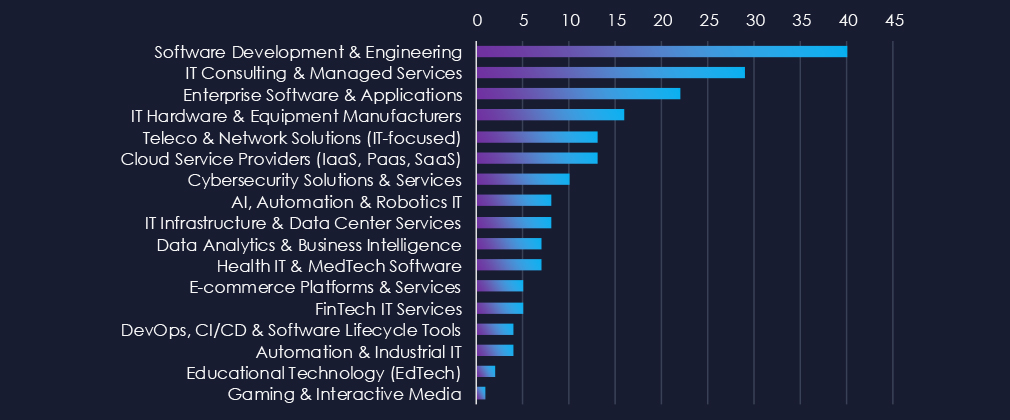
Software Development & Engineering and IT Consulting & Managed Services are the most frequent victims of ransomware in this industry. Enterprise Software & Applications placed third.
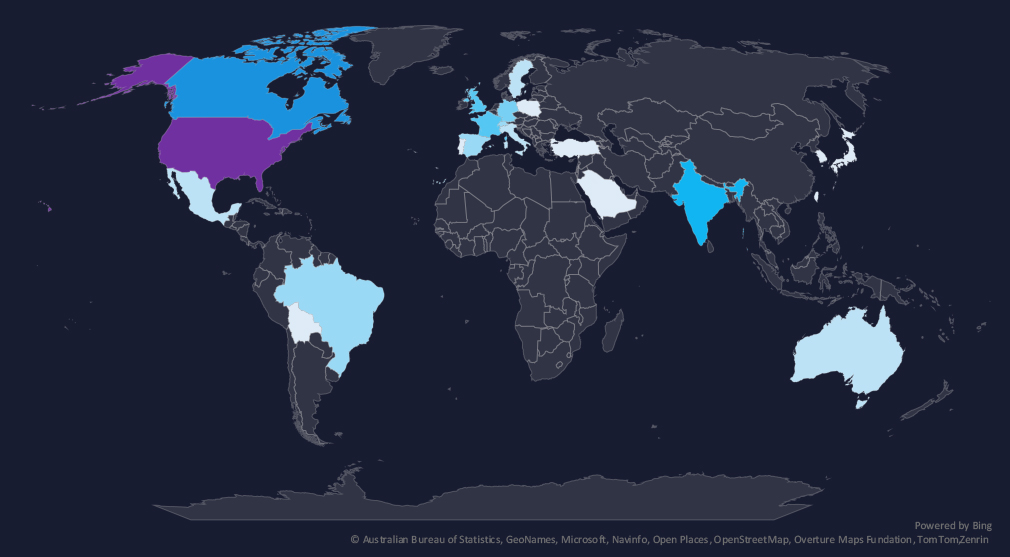
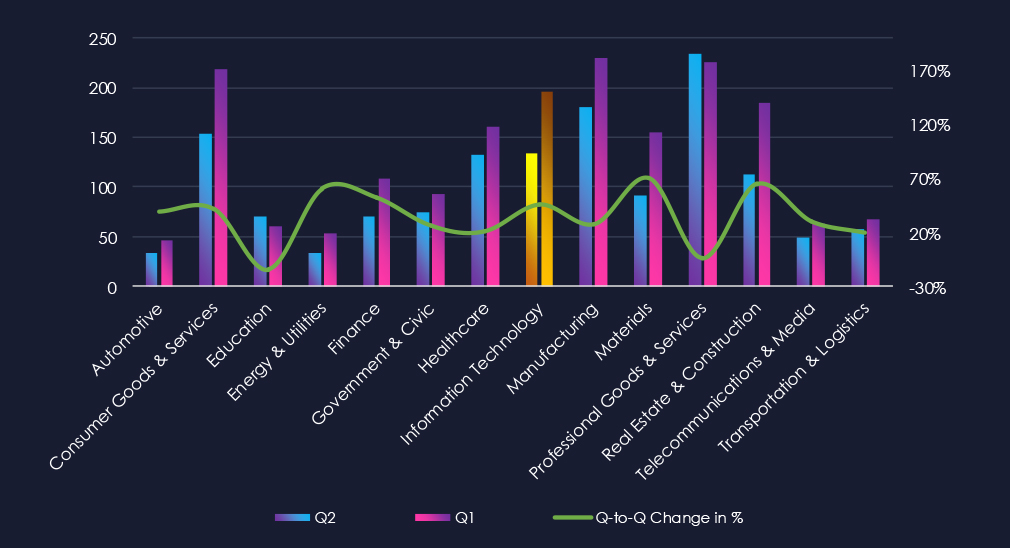
The geographic distribution heatmap underscores the widespread impact of ransomware, highlighting the countries where victims in this industry have been recorded in the last 90 days.
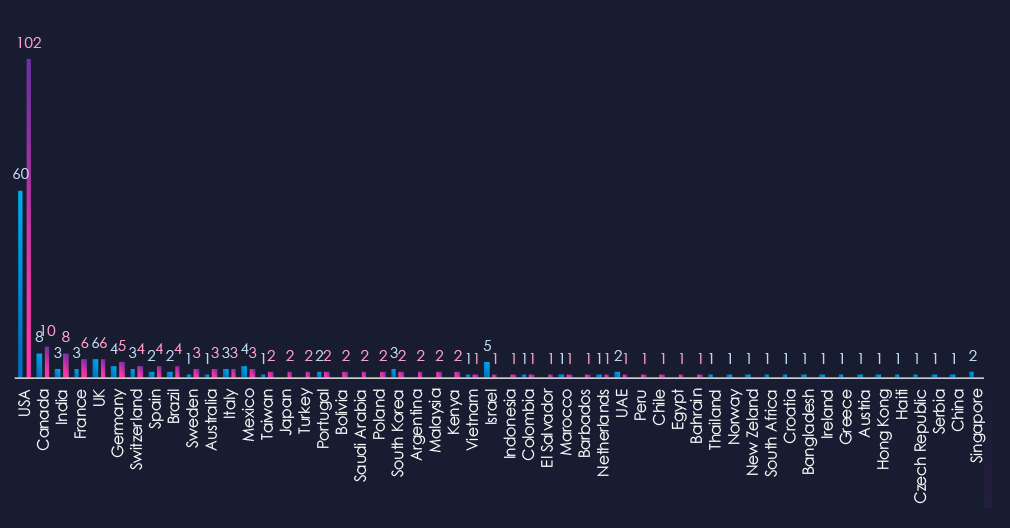
The chart shows quarter-to-quarter changes in targeted countries. Data is sorted by the last 90 days and compared to the previous 90 days, marked in blue.
In the last 90 days, the USA recorded 102 victims (52% of all victims). Canada and India follow in second and third place. France, the UK, and Germany follow on top.
37 countries in total recorded victims, exactly the same as the previous 90 days.

The information technology industry placed 4th out of 14 monitored industries, recording 196 victims in the last 90 days. A major increase of 46% from 134 victims in the previous 90-day period.
Overall share also grew from 9.1% to 10.2% of all ransomware victims.
Monthly Activity Trends
Monthly activity trends show a major spike from an average of ~50 monthly victims to 86 in October, and remaining elevated at 61 in November.
Ransomware Gangs
A total of 40 out of 70 active ransomware groups targeted this industry in the past 90 days, representing 57% participation:
Qilin: The most active, with 28 victims and 7.8% (28 out of 369) of all their victims.
Cl0p: Second most active (17.1%, 20 out of 117), driving the November numbers.
Cionbasecartel, Warlock: High shares of 24% (8 out of 33) and 27% (7 out of 26) victims among top gangs, suggesting a high focus on this industry.
Geographic Distribution
The geographic distribution of ransomware victims is relatively high yet heavily concentrated in the USA, which accounts for 52% of all victims.
Canada, India, and France recorded an increase in victims. Many new countries were hit, whereas some from the previous 90-day period did not record any new victims, illustrating the opportunistic and global nature of ransomware.
In total, 37 countries recorded ransomware victims in this industry in the last 90 days, exactly the same as in the previous period.
For a comprehensive, up-to-date global ransomware tracking report, please refer to our new monthly “Tracking Ransomware” series here.
APT Campaigns (Moderate): IT accounted for 17.9% of all industry chatter, ranking 1st, highlighting its central role in supply-chain exploitation. Data breach and data leak chatter remained extremely high and stable, tied to compromises of MSPs, cloud platforms, and software vendors. Ransomware chatter, though trending downward, remained significant due to attackers prioritizing IT firms as access multipliers. Web exploit chatter rose sharply, reflecting interest in SaaS applications and newly disclosed CVEs. Claimed hacks collapsed after an unusually high early spike, signaling a shift to private access sales. DDoS chatter rose again in the latest period, while hacktivism continued to decline.
Underground & Dark Web Chatter (High): The IT sector accounted for 17.9% of all chatter, the highest among industries. Data breach and data leak activity remained extremely high, reflecting ongoing compromises of MSPs, cloud providers, and software vendors. Ransomware chatter declined but stayed significant due to IT’s role in supply-chain access. Web exploit chatter rose sharply, while claimed hacks plunged after earlier spikes, signalling a move toward private access sales. DDoS chatter rebounded slightly; hacktivism continued to diminish.
Vulnerabilities (High): IT represented 39.4% of all CVEs, ranking 1st. RCE vulnerabilities remained dominant despite a minor recent dip. Injection flaws decreased but stayed common. XSS dropped after a mid-period spike, while DoS issues fell sharply. Memory and buffer flaws increased significantly, reflecting deeper analysis of libraries and runtime components. Privilege escalation remained elevated, with smaller increases across disclosure, traversal, and cryptographic issues.
Ransomware (High): The sector recorded 196 victims (+46%), ranking 4th, with its share rising to 10.2%. Activity surged in October and stayed elevated in November. Qilin led with 28 victims, while Cl0p drove much of the recent spike. Groups like Cionbasecartel and Warlock showed strong concentration on IT targets. Incidents spanned 37 countries, heavily led by the United States (52%), with increases in Canada, India, and France, illustrating broad, opportunistic targeting.