
The CYFIRMA Industry Report delivers original cybersecurity insights and telemetry-driven statistics of global industries, covering one sector each week for a quarter. This report focuses on the telecommunications & media industry, presenting key trends and statistics in an engaging infographic format.
Welcome to the CYFIRMA infographic industry report, where we delve into the external threat landscape of the telecommunications & media industry over the past three months. This report provides valuable insights and data-driven statistics, delivering a concise analysis of attack campaigns, phishing telemetry, and ransomware incidents targeting materials organizations.
We aim to present an industry-specific overview in a convenient, engaging, and informative format. Leveraging our cutting-edge platform telemetry and the expertise of our analysts, we bring you actionable intelligence to stay ahead in the cybersecurity landscape.
CYFIRMA provides cyber threat intelligence and external threat landscape management platforms, DeCYFIR and DeTCT, which utilize artificial intelligence and machine learning to ingest and process relevant data, complemented by manual CTI research.
For the purpose of these reports, we leverage the following data from our platform. These are data processed by AI and ML automation based on both human research input and automated ingestions.
While this report contains statistics and graphs generated primarily by automation, it undergoes thorough review and enhancement for additional context by CYFIRMA CTI analysts to ensure the highest quality and provide valuable insights.
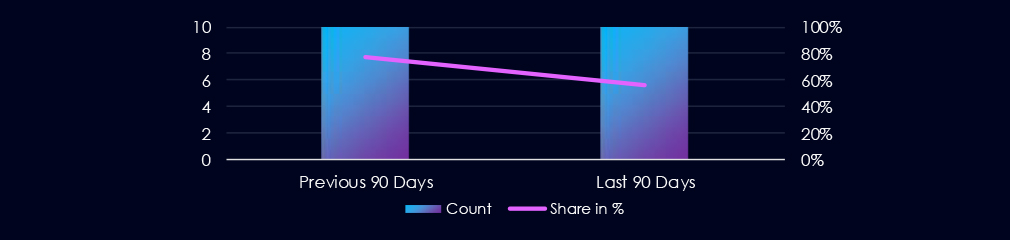
The telecommunications & media industry featured in 10 out of the 18 observed campaigns over the past 90 days, which is a presence in 56% of all campaigns. That is the same as 10 in the previous 90 days; however, a decline in the overall share from 77% (10 out of 13).

Observed campaigns detection culminated during September, calmed down during October and in November we did not observe a new campaign. Though most campaigns continue going.
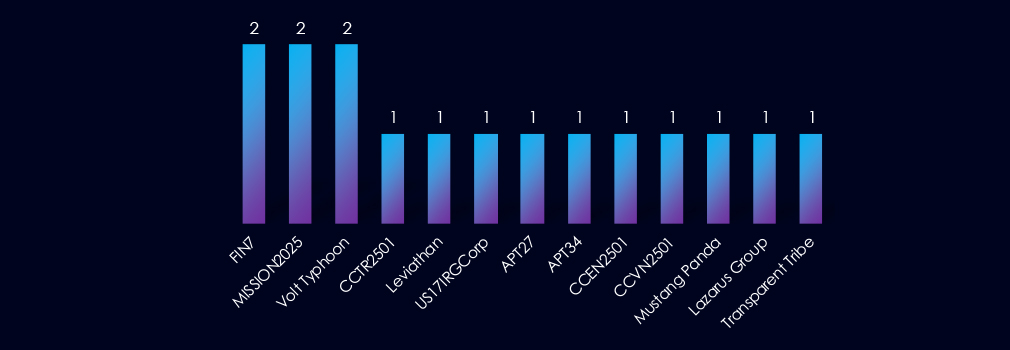
Active threat actors observed span multiple regions and motivations. Chinese state-linked groups such as Volt Typhoon, Leviathan, APT27, and Mustang Panda, as well as DPRK units like Lazarus Group. Russian FIN7 reappeared, alongside Pakistan-based Transparent Tribe and Iran-aligned APT34 or US17IRGroup. Cybercriminal clusters identified through the CC-TR/EN/VN taxonomy were also present.
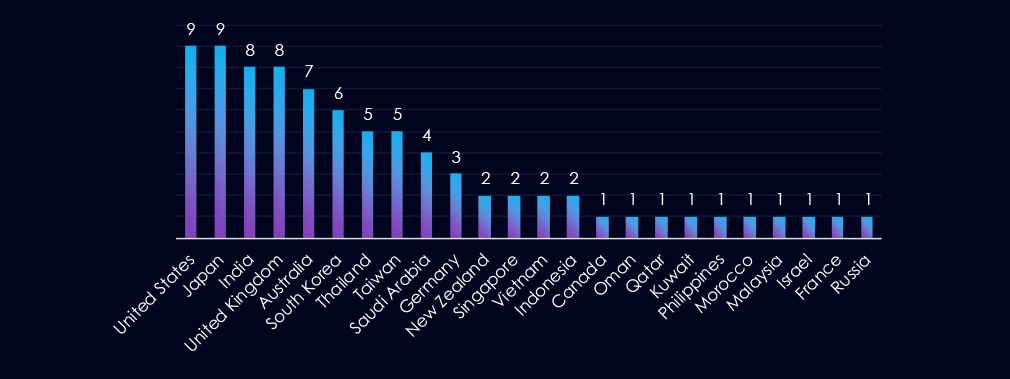
Victim organizations were distributed across a broad set of countries. The United States and Japan saw the highest concentration, followed closely by India and the United Kingdom. Australia, South Korea, Thailand, and Taiwan were also frequent targets. Additional activity affected select entities in Saudi Arabia, Germany, New Zealand, Singapore, Vietnam, Indonesia, and Canada, with isolated cases observed in Oman, Qatar, Kuwait, the Philippines, Morocco, Malaysia, Israel, France, and Russia.
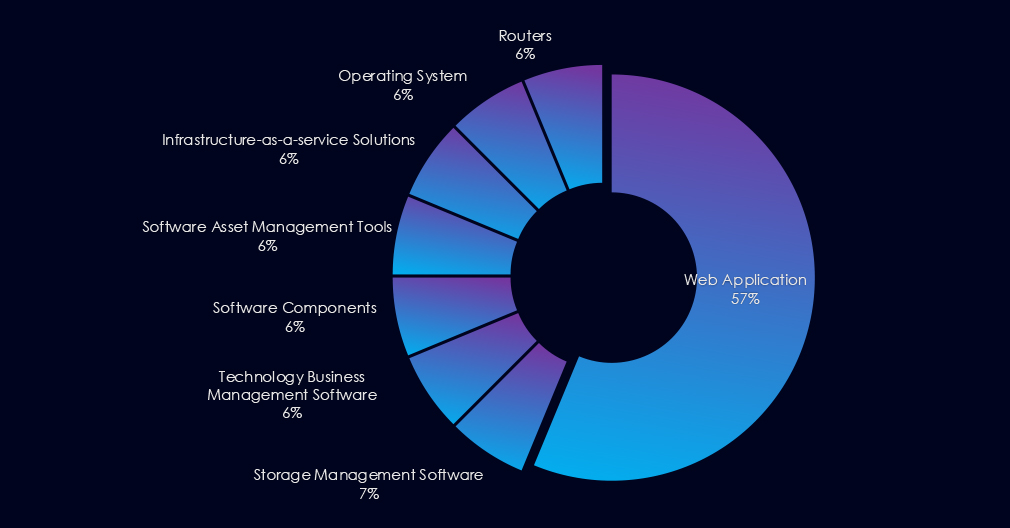
9 campaigns used Web Application as the primary attack vector. The rest focused on a wide range of technology, management tools, and software.

Over the past 90 days, the telecommunications & media industry has been significantly affected by advanced persistent threat (APT) campaigns.
Out of the 18 observed APT campaigns, 10 targeted this industry, representing 56% of the observed campaigns. This is the same as the previous 90-day period, during which 10 out of 6 campaigns targeted this industry (77%).
Monthly Trends
Key Threat Actors
Active threat actors observed span multiple regions and motivations. Chinese state-linked groups such as Volt Typhoon, Leviathan, APT27, and Mustang Panda, as well as DPRK units like Lazarus Group. Russian FIN7 reappeared, alongside Pakistan-based Transparent Tribe and Iran-aligned APT34 or US17IRGroup. Cybercriminal clusters identified through the CC-TR/EN/VN taxonomy were also present.
Geographical Impact
Overall, 25 countries recorded victims in observed campaigns. The United States and Japan lead the chart with their presence in nine observed campaigns. India and the UK share second place, while Australia and South Korea follow.
Targeted Technologies
Nine campaigns employed Web Applications as their primary attack vectors. The rest targeted various network, management, and infrastructure tools and software.
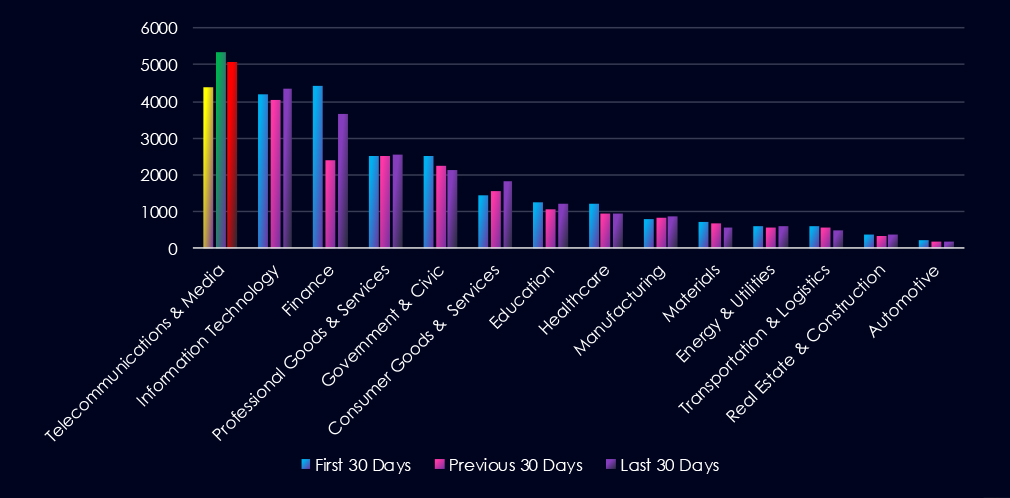
Over the past three months, CYFIRMA’s telemetry has identified 14,790 mentions of the telecommunications & media industry out of a total of 73,284 industry mentions. This is from a total of 300k+ posts across various underground and dark web channels and forums.
The telecommunications & media industry placed 1st out of 14 industries in the last 90 days with a share of 20.2% of all detected industry-linked chatter.
Below is a breakdown by 30-day periods of all mentions.
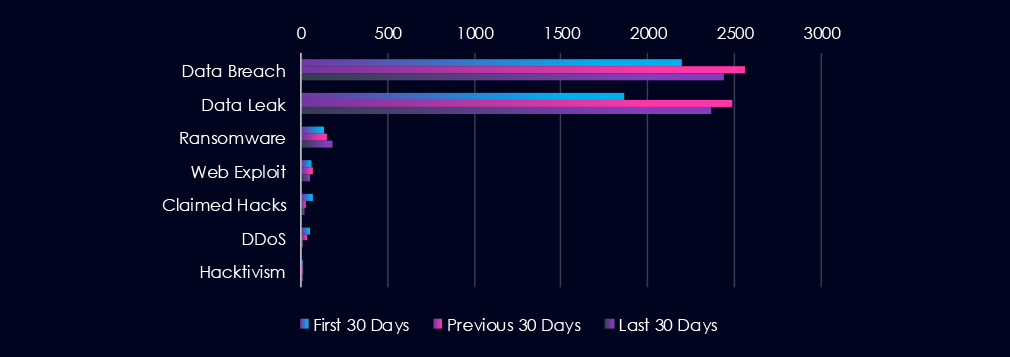
Data Leaks and Data Breaches are by far the most common category of recorded chatter for this industry, showing high sustained interest. Ransomware chatter has been mild but sustained over the past 90 days.

In total, the telecommunications & media industry comprises 20.2% of all detected industry underground and dark web chatter in the last 90 days. And ranking 1st out of 14 industries. Below are observed key trends across 90 days:
Data Breach
2194 → 2561 → 2440, Very high and consistently elevated, with only a slight dip in the latest period. Telecommunication providers remain among the most targeted entities globally, driven by their data richness, network access, and role as gateways into other industries.
Data Leak
1861 → 2489 → 2364, Follows the same pattern as breaches: extremely high activity with a modest recent decline. This indicates widespread exfiltration and sale of subscriber records, metadata, authentication tokens, and backend network information.
Ransomware
131 → 153 → 178, Gradually rising across all periods. Suggests increasing attacker pressure on telecom operators and media companies, where disruption can have cascading downstream effects and high extortion leverage.
Web Exploit
60 → 65 → 53, Stable with a slight decrease in the latest period. Indicates persistent but not escalating exploitation attempts against web-facing telecom services, content management systems, and customer portals.
Claimed Hacks
71 → 25 → 18, Sharp and continued decline. This suggests fewer public intrusions being bragged about, or a shift toward more covert monetization – especially through access sales or data brokerage rather than public disclosures.
DDoS
52 → 34 → 15, Significant and steady reduction. Implies attackers are less focused on large-scale outages and more on targeted intrusions or monetizable breaches. Could also reflect improved telecom DDoS mitigation.
Hacktivism
6 → 14 → 6, A spike mid-period followed by a return to baseline. This pattern often appears during politically charged events where telecom infrastructure is a symbolic target, but interest drops quickly afterwards.
Over the past three months, CYFIRMA’s telemetry has identified 254 mentions of the telecommunications & media industry out of a total of 3.053 industry mentions. This is from over 10k CVEs reported and updated in the last 90 days.
The telecommunications & media industry ranked 3rd out of 14 industries in the last 90 days, with a share of 8.32% of all detected industry-linked vulnerabilities.
Below is a breakdown by 30-day periods of all mentions.
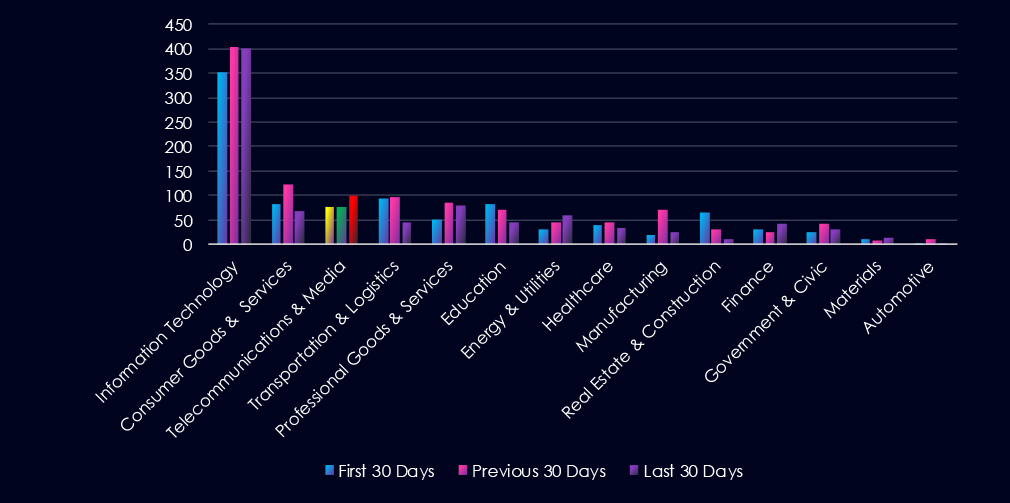
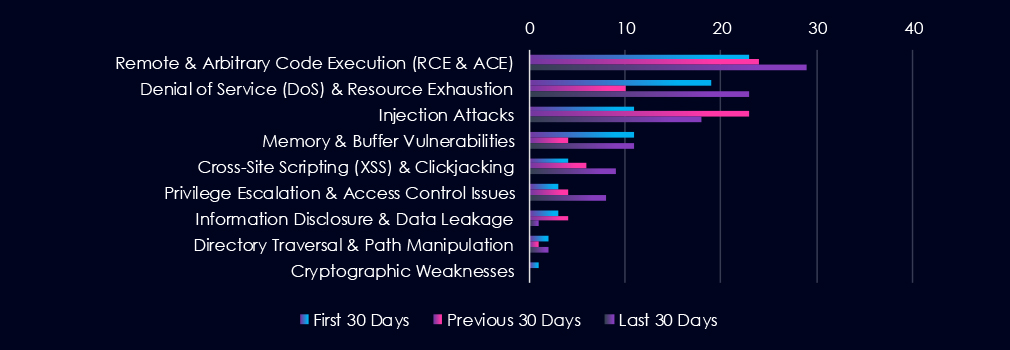
Remote & Arbitrary Code Execution (RCE & ACE) are leading the chart, as they recorded a spike during the last 30 days. Denial of Service and Injection Attacks follow in second and third place, respectively.

In total, the telecommunications & media industry comprises 8.32% of all detected industry-linked vulnerabilities in the last 90 days. And ranking 3rd out of 14 industries. Below are observed key trends across 90 days.
Remote & Arbitrary Code Execution (RCE & ACE)
23 → 24 → 29, Steady and rising. RCE remains the most critical vulnerability class in telecom and media systems, reflecting ongoing discovery of high-impact flaws in network appliances, media delivery platforms, telecom-grade routers, and signalling infrastructure.
Denial of Service (DoS) & Resource Exhaustion
19 → 10 → 23, A mid-period dip followed by a sharp resurgence. This recent spike likely corresponds to increased research attention on the telecom network.
Injection Attacks
11 → 23 → 18, A strong surge in the middle period with slightly reduced but still elevated activity recently. Suggests concentrated research on telecom portals, provisioning systems, and API-driven services.
Memory & Buffer Vulnerabilities
11 → 4 → 11, Declined mid-period but returned to higher levels. Reflects recurring issues in low-level telecom firmware, embedded devices, etc.
Cross-Site Scripting (XSS) & Clickjacking
4 → 6 → 9, Gradual upward trend. Indicates a rising number of disclosures involving web-facing dashboards, customer management portals, or media distribution systems.
Privilege Escalation & Access Control Issues
3 → 4 → 8, Climbing sharply in the latest period. Points to increased identification of weaknesses in authentication flows, role separation, and access controls.
Information Disclosure & Data Leakage
3 → 4 → 1, Noticeable drop in the latest period. Suggests fewer direct information exposure issues are being reported.
Directory Traversal & Path Manipulation
2 → 1 → 2, Low but persistent. These findings typically involve misconfigured web servers or file-handling components within telecom and media delivery stacks.
In the past 90 days, CYFIRMA has identified 65 verified ransomware victims in the telecommunications & media industry. This accounts for 3.4% of the overall total of 1,888 ransomware victims during the same period, placing the telecommunications & media industry 10th out of 14 industries.
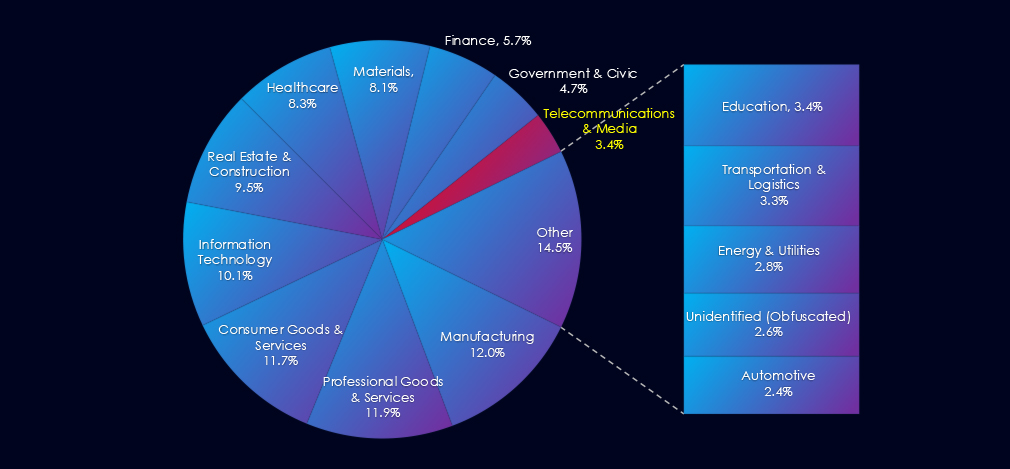
Furthermore, a quarterly comparison reveals a significant increase in victims in the telecommunications & media industry, with a growth of 32.7% from 49 to 65 victims. However, the overall share of victims only increased from 3.32% to 3.44% of all victims.
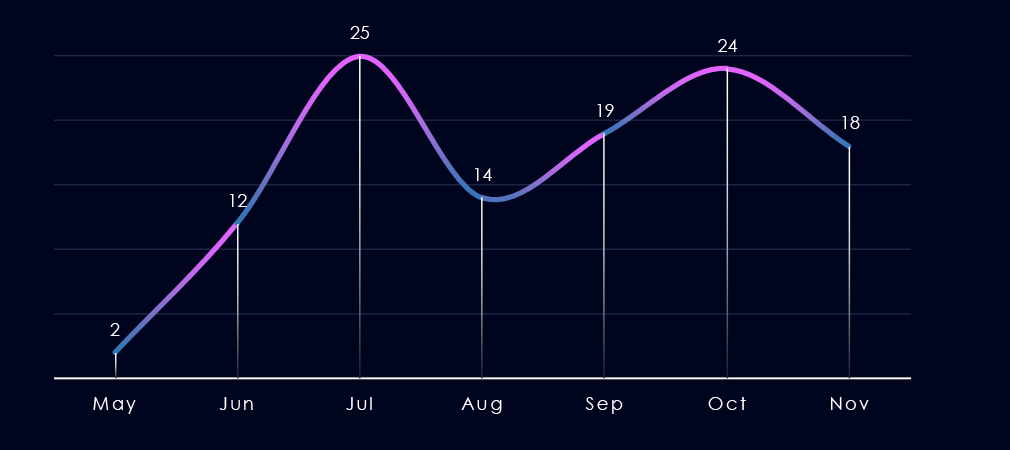
Over the past 180 days, the number of victims has been fluctuating. Ignoring just a few days of May, we can see growth into July, followed by a dip in August, then new and steady growth into October. November is likely to sustain.
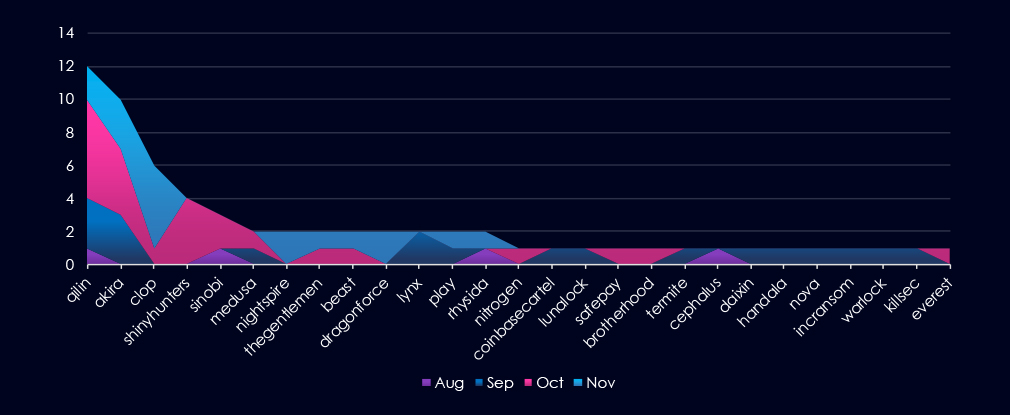
A breakdown of monthly activity per gang provides insights into which gangs were active each month. For example, the most active gang, Qilin, was active across all months. On the other hand, the third most active gang, Cl0p, recorded nearly all victims in November, presenting a recent risk.
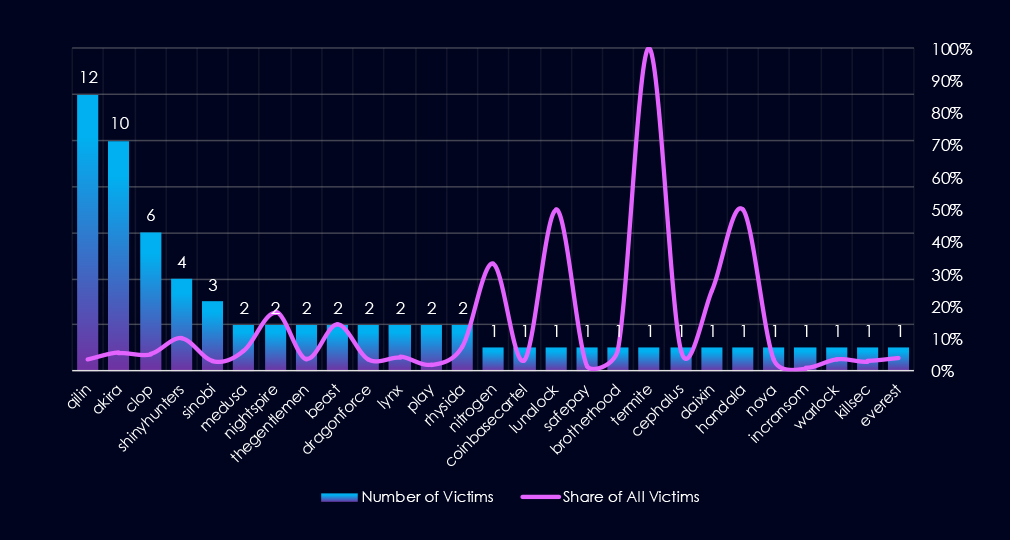
Out of the 71 gangs, 27 recorded victims in this industry in the last 90 days (38% participation). Qilin had the highest number of victims (12) but a low share (3.5%).
The share of victims for most gangs in this industry is low. From the top 10, only 3 gang with more than 1 victim recorded a share above 10%.ShinyHunters (10.3%), Nightspire (18.2%), and Beast (14.3%) had the highest share of victims, implying some focus on this industry.
Spikes of 50 or100% shares are by gangs with 1 or 2 victims overall.
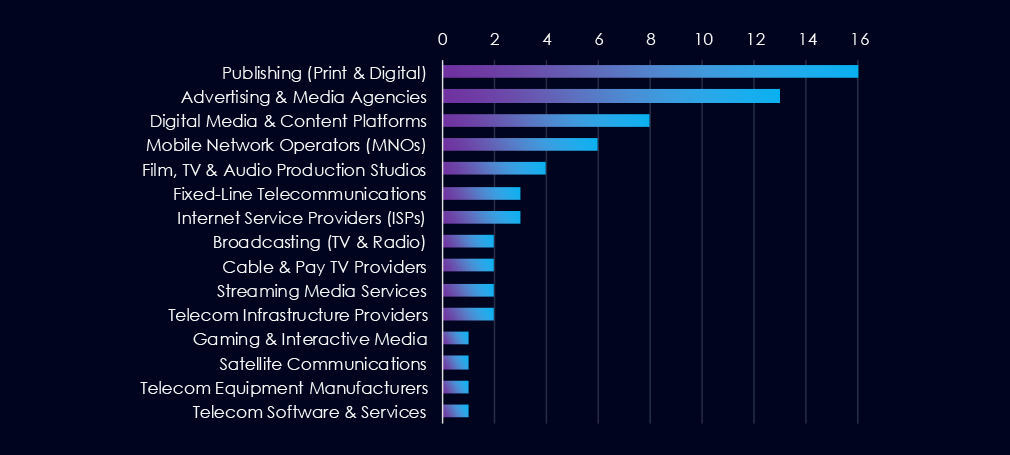
Publishing, Advertising & Media Agencies are the most frequent victims of ransomware in this industry.
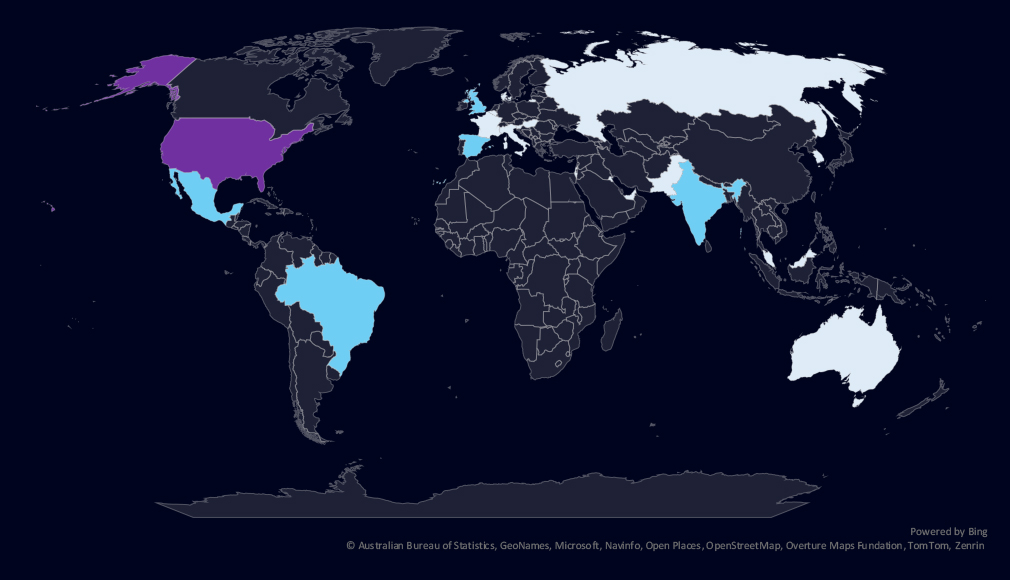
The geographic distribution heatmap underscores the widespread impact of ransomware, highlighting the countries where victims in this industry have been recorded in the last 90 days.
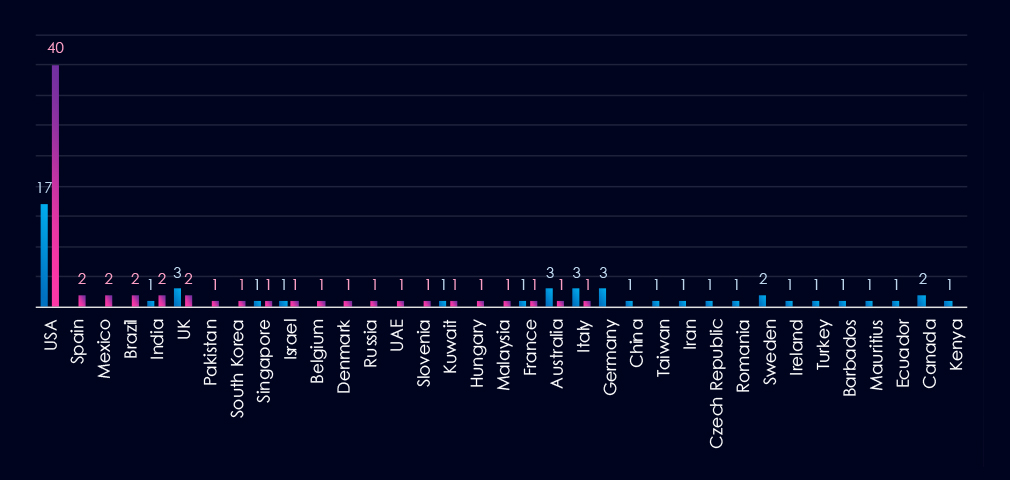
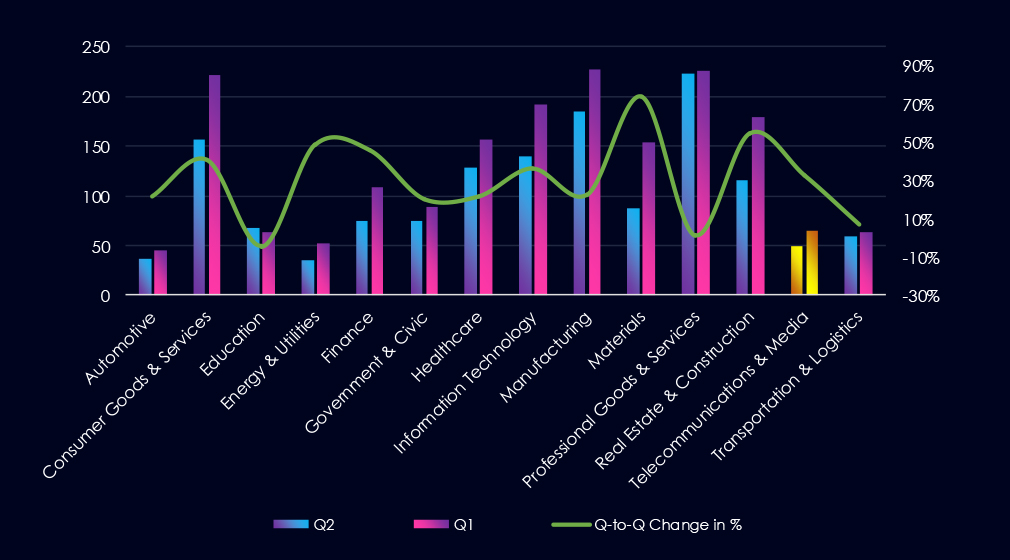
The chart shows quarter-to-quarter changes in targeted countries. Data is sorted by the last 90 days and compared to the previous 90 days, marked in blue.
In the last 90 days, the USA recorded 40 victims (62% of all victims) and is driving the uptick in victims. Many countries recorded a decline in victims despite elevated total numbers.

The telecommunications & media industry placed 10th out of 14 monitored industries, recording 65 victims in the last 90 days. Significant increase of 32% from 49 victims in the previous 90-day period.
Overall share, however, increased only slightly from 3.32% to 3.44% of all ransomware victims.
Monthly Activity Trends
Monthly activity trends show fluctuations over the past 180 days. Excluding a few days in May, July saw a high number of victims, followed by a dip in August. The number then grew towards October, and November remains elevated.
Ransomware Gangs
A total of 27 out of 71 active ransomware groups targeted this industry in the past 90 days, representing 38% participation:
Qilin: The most active, with 12 victims and 3.5% (12 out of 341) of all their victims.
Akira: Second most active with 10 victims and 5.6% (10 out of 178) share.
Nightspire, Beast, Shinyhunters: Highest shares of 18.2%, 14.3% and 10.3% victims among top gangs, suggesting elevated focus on this industry.
Geographic Distribution
The geographic distribution of ransomware victims is relatively low and *heavily concentrated in the USA, which accounts for 62% of all victims.
Notably, many previously hit countries recorded a significant decline in victims despite a higher total number of victims.
In total, 21 countries recorded ransomware victims in this industry in the last 90 days, 4 fewer than 25 in the previous period.
For a comprehensive, up-to-date global ransomware tracking report, please refer to our new monthly “Tracking Ransomware” series here.
APT Campaigns (High): In the past 90 days, 10 of 18 APT campaigns (56%) targeted telecoms & media, matching the sector’s historically high exposure. Activity peaked in September, dipped slightly in October, and remained quiet so far in November, though several campaigns continue. Threat actors included major Chinese units (Volt Typhoon, Leviathan, APT27, Mustang Panda), North Korea’s Lazarus Group, Russian FIN7, and regional actors such as Transparent Tribe and APT34. Victims spanned 25 countries, led by the US and Japan, which appeared in nearly all campaigns. India, the UK, Australia, and South Korea were also frequent targets.
Underground & Dark Web Chatter (High): Telecoms & media produced 20.2% of all industry chatter, the highest of any sector. Data breach and data leak activity remained extremely high despite a slight late-period easing, reflecting sustained compromise of subscriber and backbone network data. Ransomware chatter increased steadily, indicating renewed pressure on operators and media firms.
Vulnerabilities (High): The sector accounted for 8.32% of all CVEs, ranking 3rd, with consistently high exposure in core categories. RCE vulnerabilities increased again, underscoring risk to routers, telecom appliances, and content distribution systems. DoS vulnerabilities rebounded, indicating renewed focus on network stability issues.
Ransomware (*Low): The sector recorded 65 victims (+32%), ranking 10th, with only a modest share of all ransomware (3.44%). Monthly activity fluctuated, rising again through October–November. Qilin (12 victims) and Akira (10) led overall activity, while smaller groups like Nightspire, Beast, and ShinyHunters showed disproportionately high interest in the sector.
Victims spanned 21 countries, but attacks were *heavily concentrated in the United States (62%), even as several previously common victim geographies saw declines.