
The CYFIRMA Industry Report delivers original cybersecurity insights and telemetry-driven statistics of global industries, covering one sector each week for a quarter. This report focuses on the manufacturing industry, presenting key trends and statistics in an engaging infographic format.
Welcome to the CYFIRMA infographic industry report, where we delve into the external threat landscape of the manufacturing industry over the past three months. This report provides valuable insights and data-driven statistics, delivering a concise analysis of attack campaigns, phishing telemetry, and ransomware incidents targeting manufacturing organizations.
We aim to present an industry-specific overview in a convenient, engaging, and informative format. Leveraging our cutting-edge platform telemetry and the expertise of our analysts, we bring you actionable intelligence to stay ahead in the cybersecurity landscape.
CYFIRMA provides cyber threat intelligence and external threat landscape management platforms, DeCYFIR and DeTCT, which utilize artificial intelligence and machine learning to ingest and process relevant data, complemented by manual CTI research.
For the purpose of these reports, we leverage the following data from our platform. These are data processed by AI and ML automation based on both human research input and automated ingestions.
While this report contains statistics and graphs generated primarily by automation, it undergoes thorough review and enhancement for additional context by CYFIRMA CTI analysts to ensure the highest quality and provide valuable insights.
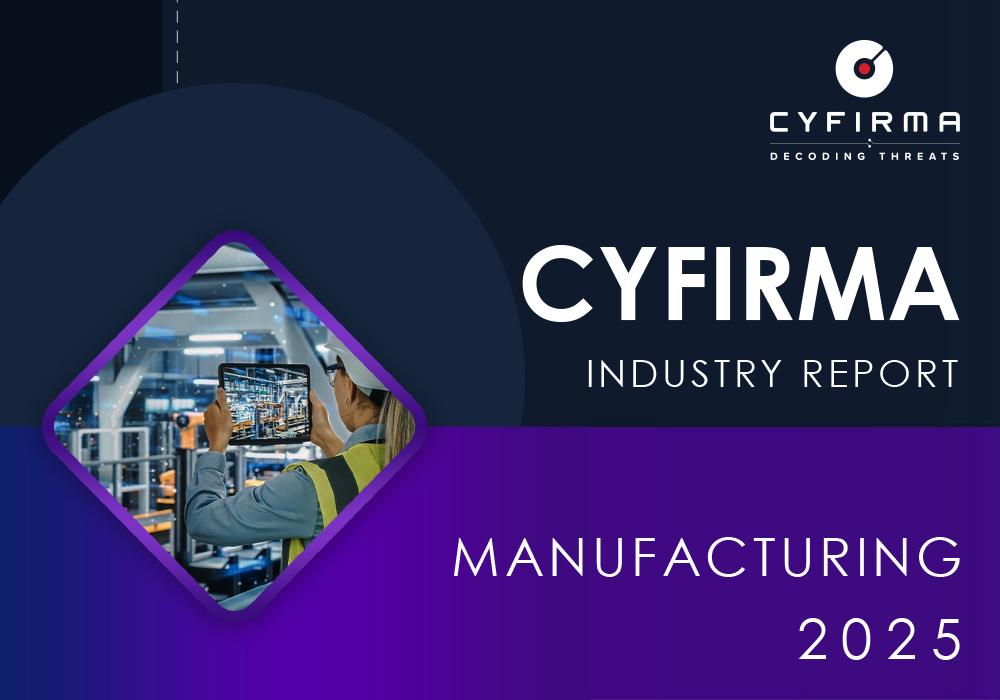
The manufacturing industry featured in 9 out of the 17 observed campaigns over the past 90 days, which is a presence in 53% of all campaigns. That is a drop from 10 in the previous 90 days, and also a decline in overall share from 63% (10 out of 16).

Most campaigns observed new updates or were detected during September. However, it is safe to say many continue into November.
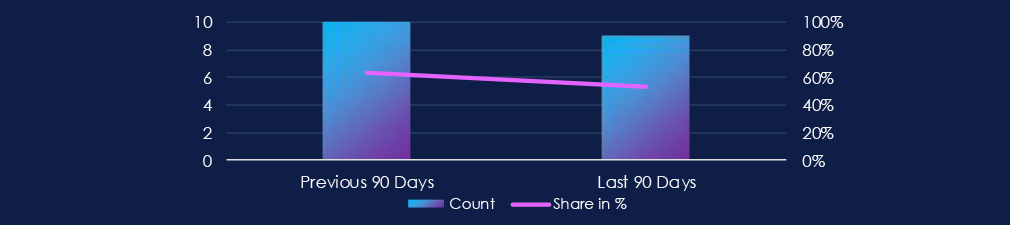
13 suspected threat actors were observed. Most prominently Chinese origin groups, DPRK’s Lazarus group and Turkish, Vietnamene and English speaking cybercrime groups.
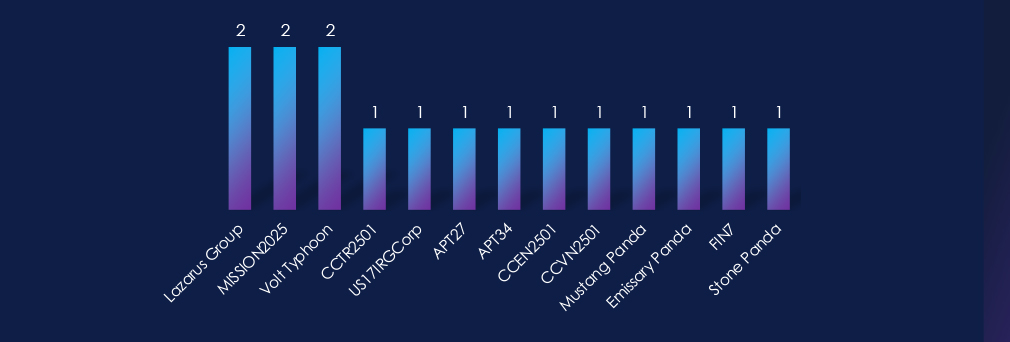
Out of 20 countries with recorded victims, India, the US, Japan and Taiwan were the most frequent. South Korea, Thailand, the UK and Australia are on share second place. Saudi Arabia closes the top 3.
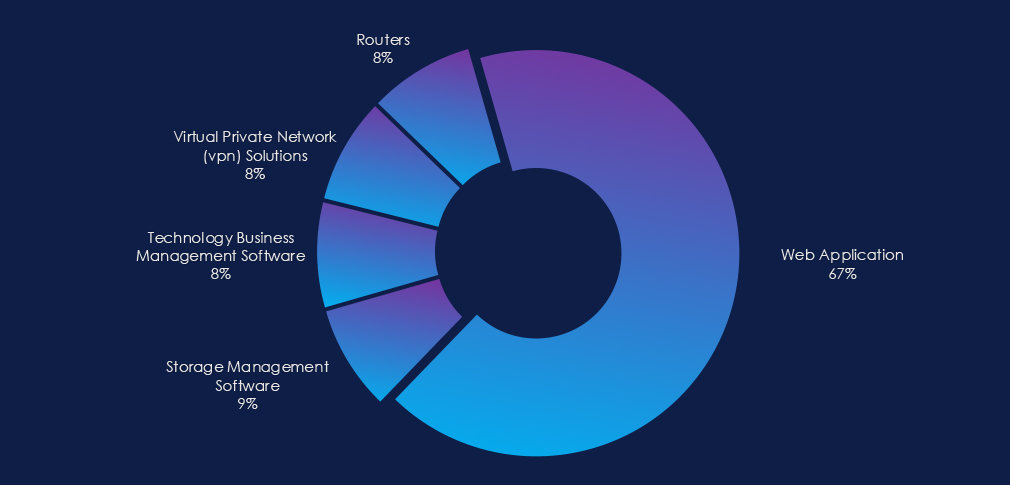
The observed campaign focused largely on web applications as the primary attack vector. Routers, VPNs, and Management software were also targeted.

Over the past 90 days, the manufacturing industry has been moderately affected by advanced persistent threat (APT) campaigns.
Out of the 17 observed APT campaigns, 9 targeted this industry, representing 53% of the observed campaigns. This is a decline from the previous 90-day period, during which 10 out of 16 campaigns targeted this industry.
Monthly Trends
The observed campaigns were observed mostly during September; however, we know many continue into November.
Key Threat Actors
Most campaigns were attributed to Chinese-origin APTs. At the same time, we have observed the Iranian nation-state group alongside the Russian FIN7 cybercrime syndicate. As well as Turkish, Vietnamese, and English-speaking cybercrime groups.
Geographic Trends
India, the US, Japan, and Taiwan shared the first place with victims in 8 out of 9 campaigns. In second place, with victims in 7 campaigns are South Korea, the UK, and Australia. IN more distant third place is Saudi Arabia with victims in 4 campaigns.
Targeted Technologies
The observed campaign focused largely on web applications as the primary attack vector. Routers, VPNs, and Management software were also targeted.
Over the past three months, CYFIRMA’s telemetry has identified 2,430 mentions of the manufacturing industry out of a total of 71,939 industry mentions. This is from a total of 300k+ posts across various underground and dark web channels and forums.
Manufacturing industry placed 9th out of 14 industries in the last 90 days, with a share of 3.38% of all detected industry-linked chatter.
Below is a breakdown by 30-day periods of all mentions.
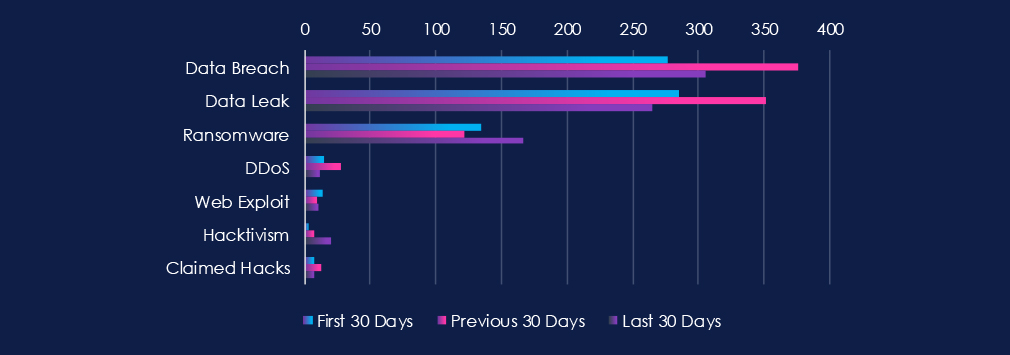
Data Leaks and Data Breaches are the most common category of recorded chatter for this industry. Both categories recorded a mild spike in the previous 30 days. Ransomware chatter mildly surged in the last 30 days.

In total, the manufacturing industry comprises 3.38% of all detected industry underground and dark web chatter in the last 90 days. And ranking 9th out of 14 industries.
Below are observed key trends across 90 days:
Data Breach
277 → 376 → 306, Elevated across all periods, with a mid-period peak followed by a slight cooling. This reflects persistent targeting of manufacturing networks, often through suppliers, OT/IT convergence points, and exposed credentials.
Data Leak
285 → 352 → 265, Mirrors the breach trend: high, then tapering. The declines likely indicate fewer public leak postings, but not necessarily fewer compromises – actors increasingly sell manufacturing access privately.
Ransomware
134 → 122 → 167, A notable resurgence in the most recent period. This aligns with ransomware crews’ focus on industries with low tolerance for downtime, including production plants and supply chain hubs.
DDoS
15 → 28 → 12, Spiked mid-period but dropped sharply. Suggests waves of extortion-motivated disruption attempts rather than sustained campaigns.
Web Exploit
14 → 9 → 11, Stable at low levels. Attackers appear to rely more on credential abuse and lateral movement through suppliers than on exploiting manufacturing web assets directly.
Hacktivism
3 → 7 → 20, Significant recent increase. This may reflect geopolitical or environmental campaigns targeting manufacturers, particularly those tied to defence, energy, or sensitive supply chains.
Claimed Hacks
7 → 13 → 7, Peak in the middle period followed by normalization. Suggests a period of increased public boasting or high-visibility compromises, now reduced — potentially due to shifts back to private marketplaces.
Over the past three months, CYFIRMA’s telemetry has identified 117 mentions of the manufacturing industry out of a total of 3,180 industry mentions. This is from over 10k CVEs reported and updated in the last 90 days.
The manufacturing industry ranked 10th out of 14 industries in the last 90 days, with a share of 3.68% of all detected industry-linked vulnerabilities.
Below is a breakdown by 30-day periods of all mentions.
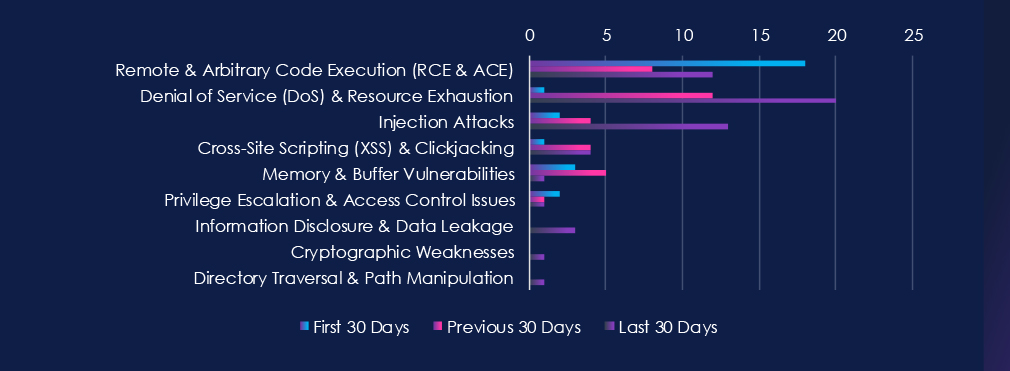
Remote & Arbitrary Code Execution (RCE & ACE) are leading the chart, as they recorded mostly sustained CVE reports. Denial of Service (DoS) & Resource Exhaustion vulnerabilities are second with dramatic growth over the last two 30-day periods. Third place belongs to the Injection attack, which recorded a jump in the last 30 days.

In total, the manufacturing industry comprises 3.68% of all detected industry-linked vulnerabilities in the last 90 days. And ranking 10th out of 14 industries.
Remote & Arbitrary Code Execution (RCE & ACE)
18 → 8 → 12, High but variable reporting. Indicates ongoing discovery of serious flaws in manufacturing software, OT systems, and embedded controllers, with periodic spikes aligned to vendor patch cycles.
Denial of Service (DoS) & Resource Exhaustion
1 → 12 → 20, A steep rise over the last two periods. Likely reflects targeted research in OT/ICS where DoS issues can disrupt operations even without code execution — critical in real-time production environments.
Injection Attacks
2 → 4 → 13, Steady growth culminating in a sharp jump. Suggests increased scrutiny of poorly validated interfaces, MES platforms, and device-facing APIs vulnerable to input manipulation.
Cross-Site Scripting (XSS) & Clickjacking
1 → 4 → 4, Moderate and consistent disclosures in manufacturing dashboards, web-based HMIs, and vendor portals.
Memory & Buffer Vulnerabilities
3 → 5 → 1, Sharp decline after mid-period interest. May indicate reduced focus on legacy embedded systems or recent mitigation of earlier memory safety issues.
Privilege Escalation & Access Control
2 → 1 → 1, Low but persistent. Occasional weaknesses continue in the authentication and role management layers of manufacturing platforms.
Information Disclosure & Data Leakage
0 → 0 → 3, Newly emerging. Highlights isolated but notable exposures of sensitive operational or configuration data.
Cryptographic Weaknesses
0 → 0 → 1, Minimal but notable, showing occasional flaws in encryption or key handling within industrial systems.
Directory Traversal & Path Manipulation
0 → 0 → 1, Rare but relevant, especially where file integrity and system paths influence equipment behaviour.
In the past 90 days, CYFIRMA has identified 221 verified ransomware victims in the manufacturing industry. This accounts for 12.3% of the overall total of 1,796 ransomware victims during the same period, placing the manufacturing industry 2nd out of 14 industries.
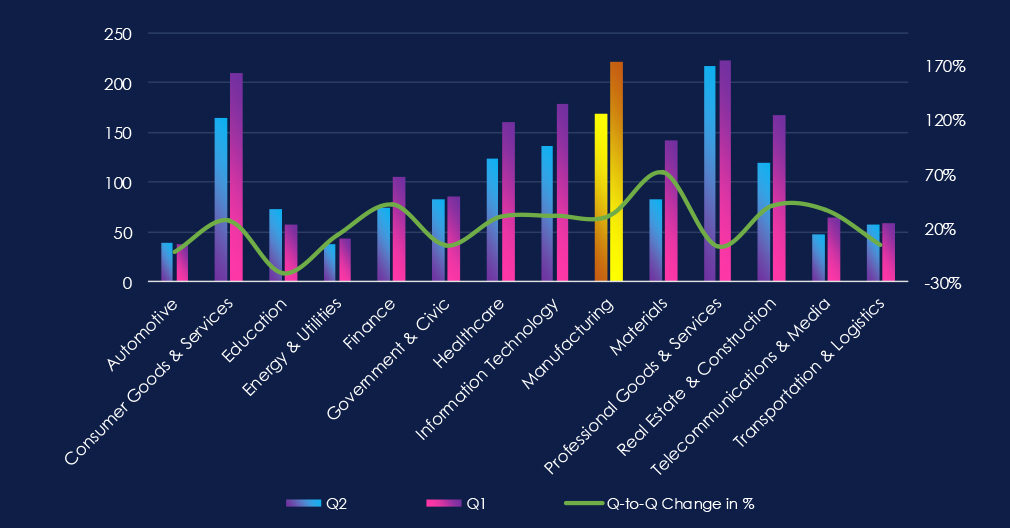
Furthermore, a quarterly comparison reveals a substantial growth of victims in the manufacturing industry, with an increase of 30.8% from 169 to 221 victims. While the overall share of victims also increased, though more modestly, from 11.47% to 12.31% of all victims.
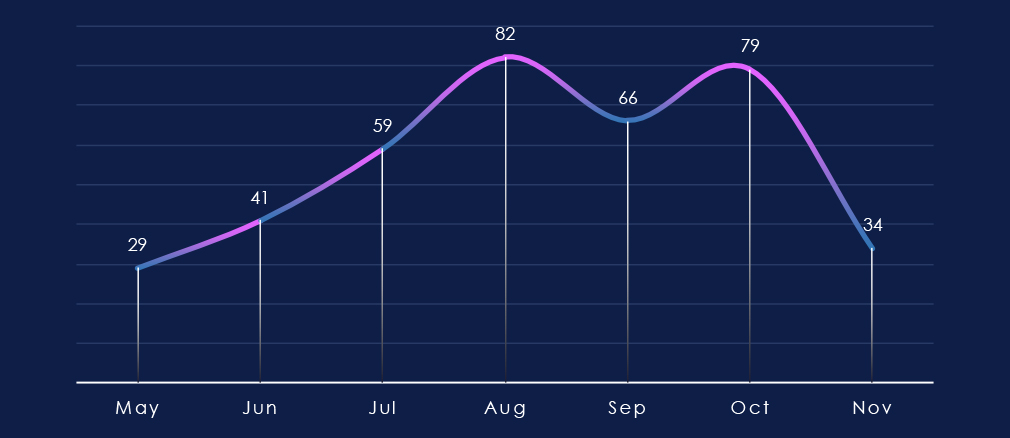
Over the past 180 days, the monthly trendline shows a clear observation of the increase in manufacturing victims of ransomware culminating in August and remaining elevated into October and even November so far.
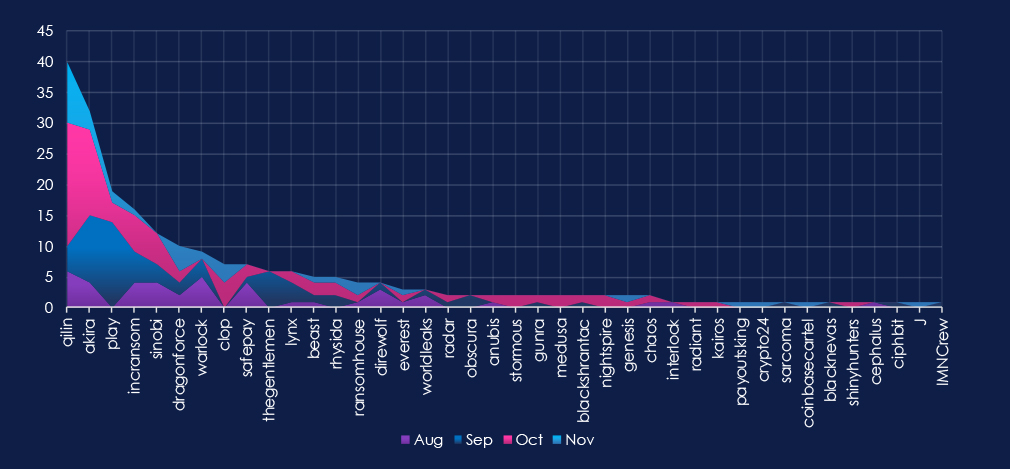
A breakdown of monthly activity per gang provides insights into which gangs were active each month. For example, by far the most active gangs, Qilin and Akira, were highly active across all months, with a major increase during October for Qilin. On the other hand, the third most active group, Play, recorded the most victims in September.
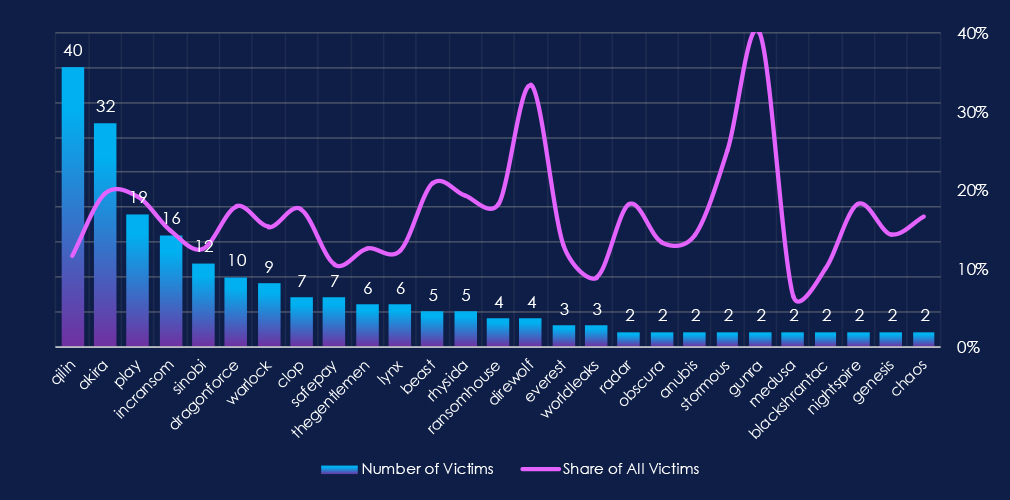
The chart above shows only the top victims with at least 2 victims. Out of the 72 gangs, 40 recorded victims in this industry in the last 90 days (56% participation). Qilin had the highest number of victims (40).
The share of victims for most gangs in this industry is high. From all 40 gangs, only seven gangs recorded a share below 10%.
Among the top gangs, Akira (19.4%), Draghonforce (17.9%), and Cl0p (17.5%) had the highest share of victims, implying a focus on this industry.
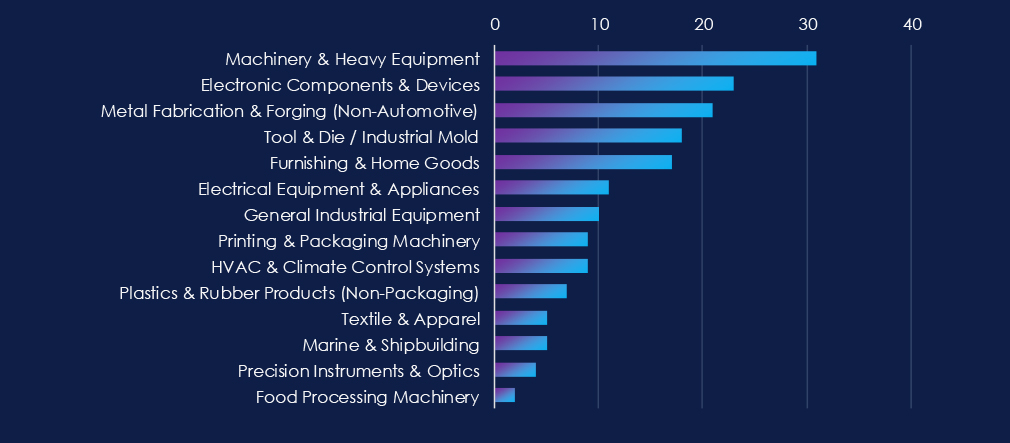
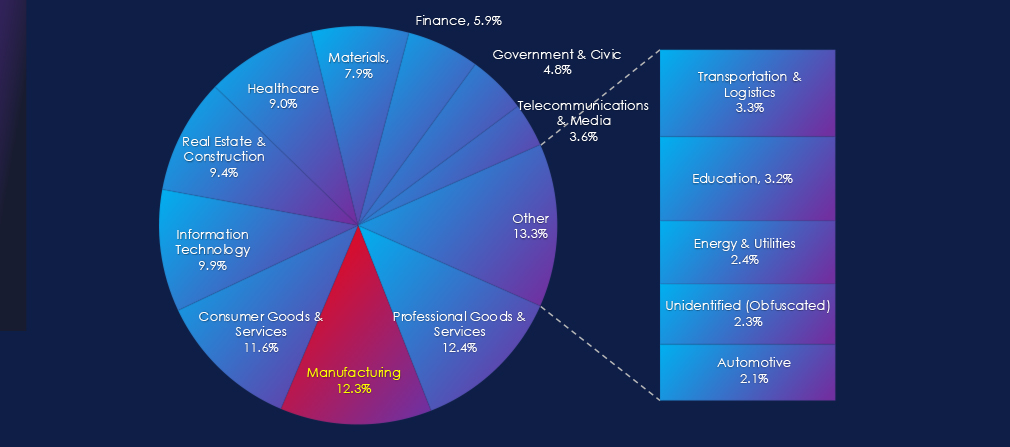
Machinery & Heavy Equipment manufacturing, Electronic Components & Devices, and Metal Fabrication & Forging (Non-Automotive) sectors are the most frequent victims of ransomware in this industry.
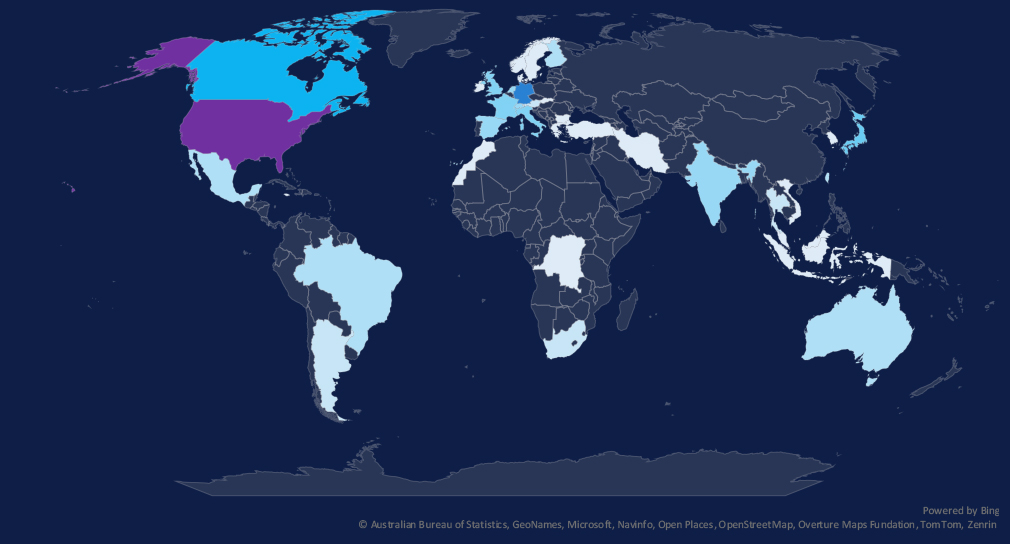
The geographic distribution heatmap underscores the widespread impact of ransomware, highlighting the countries where victims in this industry have been recorded in the last 90 days.
The chart shows quarter-to-quarter changes in targeted countries. Data is sorted by the last 90 days and compared to the previous 90 days, marked in blue.
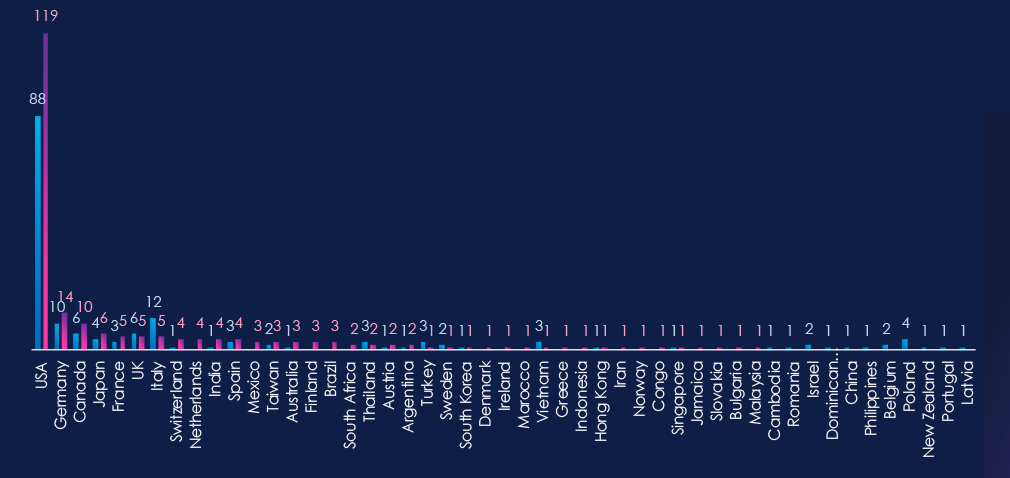
In the last 90 days, the USA recorded 119 victims (54% of all victims). Germany, Canada, Japan, and France recorded upticks from the previous 90-day period.
In total, 38 countries recorded victims in the last 90 days.

The manufacturing industry placed 2nd out of 14 monitored industries, recording 221 victims in the last 90 days. Significant increase of 31% from 169 victims in the previous 90-day period.
Overall share also increased, but more moderately, from 11.5% to 12.3% of all ransomware victims.
Monthly Activity Trends
After a period of lower activity, there was a remarkably sharp growth of victims in August. Since then, numbers have remained elevated all the way into November.
Ransomware Gangs
A total of 40 out of 72 active ransomware groups targeted this industry in the past 90 days, representing a 56% participation:
Qilin: The most active, with 40 victims and 12% (40 out of 343) of all their victims.
Akira: Second most active with 32 victims and 19% (32 out of 165) share.
Play: Third place with 19% (19 out of 100) share of victims.
Geographic Distribution
The geographic distribution of ransomware victims is relatively high yet heavily concentrated in the USA, accounting for 54% of all victims.
Notably, countries like Canada, Germany, Japan, and France recorded upticks in victims.
In total, 38 countries recorded ransomware victims in this industry in the last 90 days, six more than 32 in the previous period.
For a comprehensive, up-to-date global ransomware tracking report, please refer to our new monthly “Tracking Ransomware” series here.
APT Campaigns (Moderate): Manufacturing remained a key APT target, with 9 of 17 campaigns (53%) impacting the sector, down slightly from the prior period. Activity concentrated in September, with several campaigns continuing into November. Most activity originated from Chinese APTs, alongside Iranian state operators, Russia’s FIN7, and Turkish, Vietnamese, and English-speaking cybercrime groups. Victims were heavily concentrated in India, the US, Japan, and Taiwan (hit in 8 campaigns), followed by South Korea, the UK, and Australia (7 each). Attackers primarily targeted web applications, with routers, VPN devices, and management systems also common entry points.
Underground & Dark Web Chatter (Low): Manufacturing accounted for 3.38% of industry chatter (9th of 14). Data breach and leak activity remained high, with mid-period peaks suggesting sustained compromise attempts across OT/IT environments and suppliers. Ransomware chatter rose again in the latest 30 days, consistent with the sector’s low tolerance for downtime. DoS and hacktivism trends were volatile: DoS surged mid-period, then dropped, while hacktivism spiked sharply to 20 mentions, likely tied to geopolitical or environmental targeting. Web exploit and claimed hack activity stayed generally low.
Vulnerabilities (Moderate): The sector accounted for 3.68% of industry-linked CVEs, with an uptick in the final 30 days. RCE and DoS disclosures remained high, with DoS rising steeply (1 → 12 → 20). Injection flaws also grew sharply, highlighting weak validation across industrial software and interfaces. XSS remained steady, memory flaws declined, and small numbers of access control, disclosure, cryptographic, and traversal weaknesses emerged.
Ransomware (High): Manufacturing ranked 2nd overall with 221 victims (+31%). Activity surged in August and stayed elevated through November. Forty ransomware groups (56% of all active) hit the sector. Qilin led with 40 victims, followed by Akira (32) and Play (19). The US accounted for 54% of all victims, with increases across Canada, Germany, France, and Japan. A total of 38 countries were impacted.