Published On : 2025-10-23
EXECUTIVE SUMMARY
The global cyber threat landscape is defined by state-aligned adversaries anchored by China and Russia operating alongside a resilient cybercrime ecosystem that thrives on ransomware, data leaks, and supply chain exploitation. Attackers are professionalizing, masking attribution, and blending espionage with financial motives, while focusing on high-leverage sectors such as IT services, manufacturing, government, and consumer-facing industries. Web applications, identity systems, and known exploited vulnerabilities remain the primary entry points, with bursts of activity around Microsoft, Apple, and Edge devices. The rise of “unknown” actors, darkweb data markets, and AI-enabled attacks points to a future of faster, stealthier, and more commercially driven campaigns, making resilience, speed of detection, and supply chain risk management critical priorities for executives.
EMERGING TRENDS IN THE GLOBAL CYBER THREAT LANDSCAPE
Adversary Gravity: China + Russia at the Core, Rising Unknowns
China and Russia drive most global campaigns, with DPRK as a steady second tier and a fast-growing share of “unknowns.” This reflects stronger obfuscation of origins through brokers and contractor models, raising misattribution risk and enabling adversaries to blend espionage with financial operations.
Ransomware: Higher Baseline, Rotating Brands
CYFIRMA observed ransomware incidents stabilizing at a higher monthly baseline, with leadership shifting from groups like LockBit to Qilin and Akira. The ecosystem shows resilience names change, but the operating model of data theft and extortion persists.
Data is the Product
Darkweb chatter is shifting toward breaches and leaks over ransomware, with finance and government data in high demand. Criminal markets now prize sellable datasets over disruption, fueling fraud and identity abuse at scale.
Supply Chain Leverage via Services and Telecoms
CYFIRMA observed sustained targeting of IT services, professional services, and telecoms sectors that provide attackers access into many downstream organizations. This “one-to-many” exposure amplifies business risk across industries.
Web and Identity as the Front Door
CYFIRMA observed web applications as the dominant target surface, with operating systems and identity infrastructure close behind. Exploited web-to-identity paths remain the most common entry route for both espionage and criminal campaigns.
KEVs: Bursts on Microsoft, Apple, and Edge Devices
CYFIRMA observed recurring exploitation spikes tied to Microsoft, Apple, and perimeter appliances like Ivanti, Fortinet, and Cisco. Attackers exploit patch delays in widely deployed, high-friction assets to gain initial access quickly.
Quiet Pre-Positioning and LOTL Tradecraft
CYFIRMA observed state-aligned actors favoring routers, VPNs, and cloud admin paths for long-term persistence. Living-off-the-land techniques extend dwell time and increase the likelihood of disruptive campaigns.
Sector Focus: Services, Consumer Brands, Manufacturing, Government
CYFIRMA observed consistent targeting of professional services, IT, consumer goods, manufacturing, and government sectors. Attacks in these areas simultaneously threaten operational continuity and brand trust.
Regional Weight: APAC and U.S. Corridors
CYFIRMA observed sustained targeting of the U.S., Japan, India, South Korea, Thailand, and the U.K. highlighting adversaries’ focus on APAC supply chains and U.S. economic gravity.
Ecosystem Professionalization, Less Noise
Declining hacktivist chatter and fewer “claimed hack” posts, replaced by structured data brokerage and tighter affiliate networks. Cybercrime is becoming quieter, faster, and more commercially driven.
AI as an Accelerant
Adversaries adopting AI for phishing, social engineering, and scaling reconnaissance. Automation is lowering barriers to entry, making high-quality attacks accessible to a broader set of actors.
TRENDS FROM THE DARK WEB – CAMPAIGNS
Here, we analyze our DeCYFIR platform data from our Dark Web research and how it impacts existing clients by looking at similar organizations in the same region and industry. This allows for interesting threat intelligence, and highlights which key Advanced Persistent Threats to be aware of.
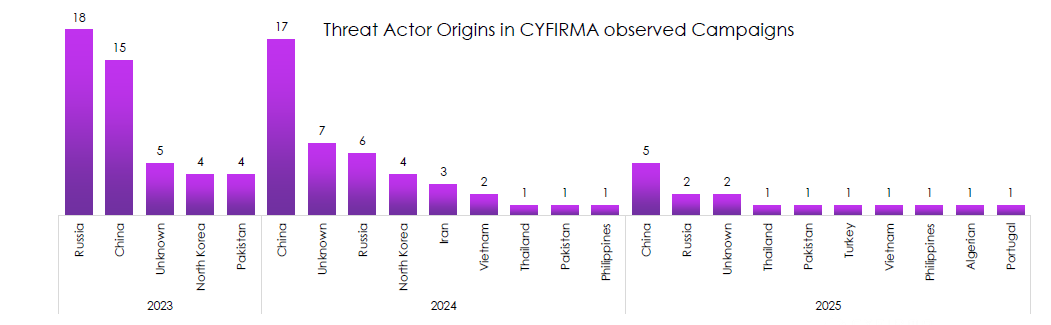
Threat Actor Origins by Year
CYFIRMA observed campaigns attributed primarily to China and Russia, with a visible rise in unattributed activity.
- China leads or co-leads across the period, peaking in 2024, which tracks with sustained PRC state and contractor operations as well as financially motivated spillover.
- Russian activity is consistently high in 2023 and 2024, then lighter YTD 2025, likely a timing effect and operational reprioritization rather than a real decline.
- Unknown origin climbs meaningfully in 2024, signaling better OPSEC, use of brokers, and layered infrastructure that blurs attribution.
- 2025 introduces a wider tail of one-off origins including Thailand, Pakistan, Turkey, Philippines, Algeria, and Portugal, suggesting opportunistic or regional crews testing capability.
- Executive takeaway: the center of gravity remains China and Russia; resource planning and threat modeling should weight their tradecraft and target sets first, while monitoring the growing “unknown” slice as a risk to forecasting.
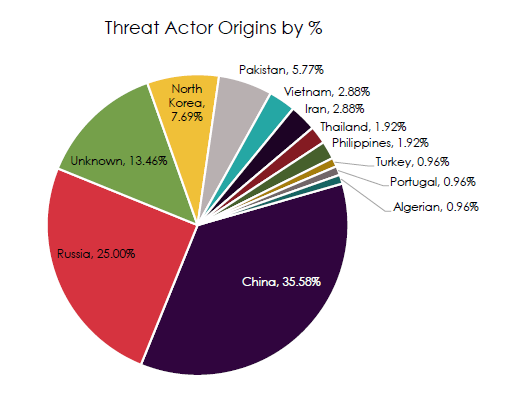
Threat Actor Origins by Percentage
CYFIRMA observed a two-actor majority and a meaningful gray zone.
- China accounts for roughly a third-plus of observed origin attributions.
- Russia contributes about a quarter, making the China–Russia bloc the clear majority of activity.
- Unknown origin is nontrivial at ~13 percent, indicating persistent attribution masking and proxy use.
- DPRK sits in the mid single digits, enough to matter for financial theft and supply chain targeting.
- Pakistan, Iran, Vietnam, Thailand, and the Philippines form a long tail that can still create outsized impact via opportunistic campaigns.
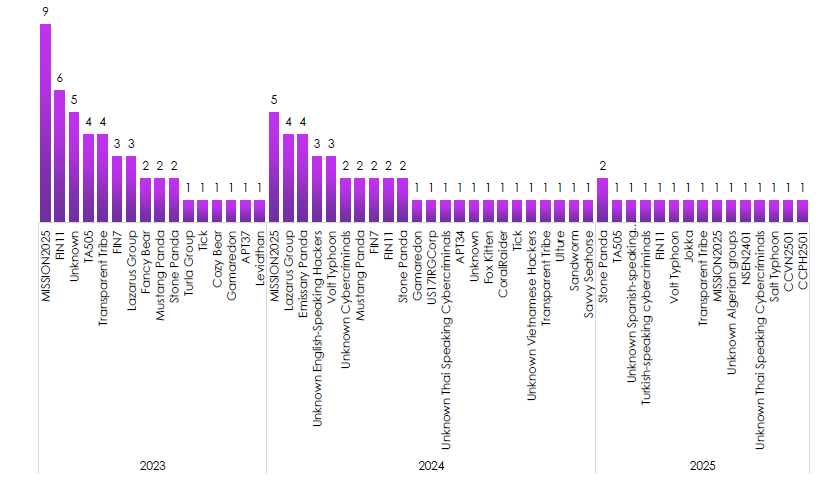
Suspected Active Threat Actors
CYFIRMA observed a blend of state-linked units and financially motivated crews persisting year over year.
- 2023 shows heavy activity by MISSON2025 and FIN11 alongside Transparent Tribe and FIN7, highlighting concurrent espionage and monetization.
- 2024 brings more PRC and DPRK activity in the mix, with Lazarus, Emissary Panda, and Volt Typhoon appearing repeatedly.
- 2025 is more fragmented YTD, with Savvy Seahorse, Volt Typhoon, Transparent Tribe, and others showing single or double hits, which often precedes escalation or campaign rotation.
- Recurrent names across years signal durable tasking and capability reuse rather than one-off spikes.
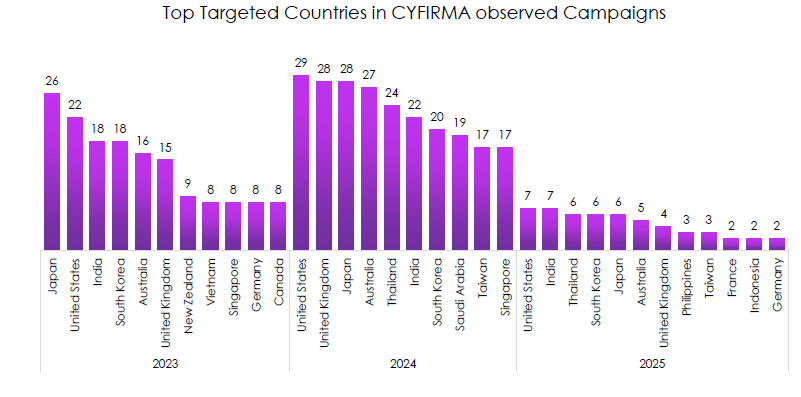
Top Targeted Countries
CYFIRMA observed concentration on the United States, Japan, India, South Korea, Australia, the UK, and – increasingly – Thailand.
- 2023: Japan tops the list, with the US, India, and South Korea close behind. Clear APAC emphasis.
- 2024: the US edges to the top, but Japan and the UK remain near-equal, while Thailand jumps into the top tier.
- 2025 YTD: US and India lead, then Thailand, South Korea, and Japan; expect totals to grow as the year progresses.
- The persistent focus on US allied economies and APAC manufacturing hubs aligns with espionage, IP theft, and supply chain leverage.
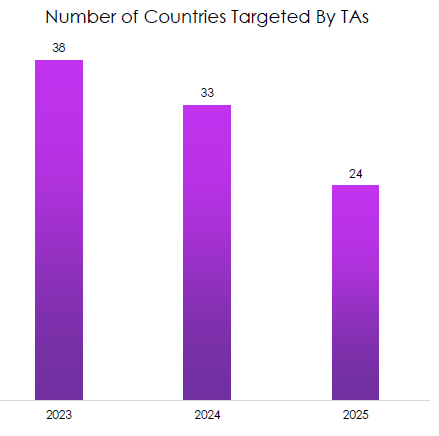
Number of Countries Targeted
CYFIRMA observed a decline in the count of distinct countries targeted from 2023 to 2025 YTD.
- 38 countries in 2023 to 33 in 2024 to 24 YTD 2025 shows narrowing breadth.
- Interpreted cautiously, this suggests deeper campaigns against fewer geographies rather than universal “spray-and-pray”.
- It may also reflect partial-year effects, but the direction matches a shift to persistent access and long dwell.
- Narrowing geography often correlates with higher operational maturity and longer-term objectives.
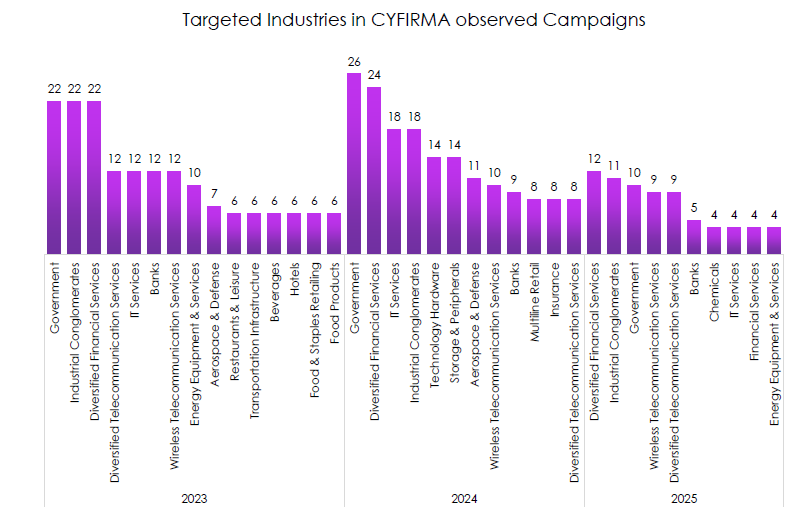
Most Targeted Industries
CYFIRMA observed sustained pressure on Government, IT Services, Financial Services, Industrial Conglomerates, and Telecom.
- Government remains the most consistently targeted across years, reflecting geopolitical collection and disruption objectives.
- IT Services and telecom categories are repeatedly hit, highlighting adversaries’ preference for leverage points into many downstream clients.
- Financial Services is consistently high, with Diversified Financial Services leading 2025 YTD, indicating steady monetization and data-theft motivation.
- Industrial Conglomerates and Technology Hardware appear strongly in 2024, pointing to supply chain and manufacturing espionage.
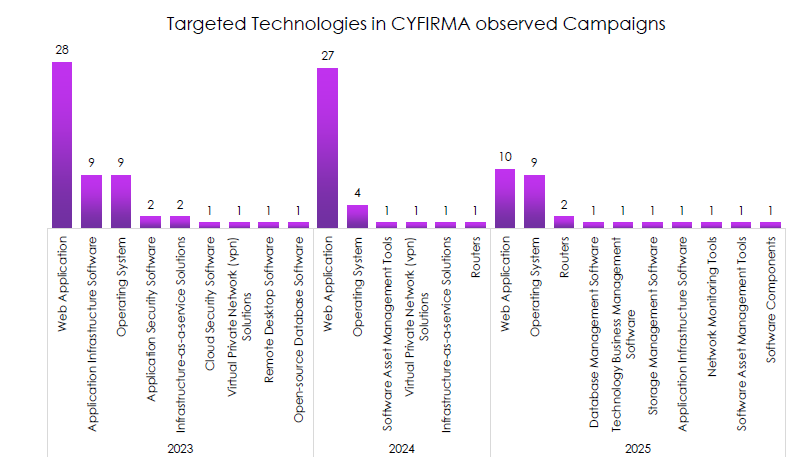
Targeted Technologies by Year
CYFIRMA observed web applications as the dominant target surface every year, followed by operating systems and a growing set of edge assets.
- Web applications overwhelmingly lead in 2023 and 2024 and still dominate 2025 YTD.
- Operating system targeting is second and rising in 2025 YTD, signaling more post-exploitation and privilege abuse.
- Routers and other edge devices feature more in 2025, consistent with living-off-the-land access and prepositioning.
- Occasional hits on VPNs, asset management tools, and infrastructure-as-a-service show interest in control planes and identity-rich systems.
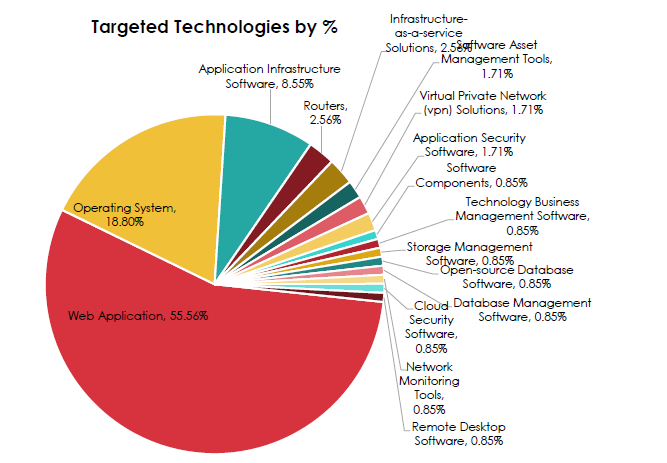
Targeted Technologies by Percentage
CYFIRMA observed a simple rule of thumb that should drive control investment.
- Web applications account for more than half of all targeted technologies.
- Operating systems are nearly one-fifth, making web-to-OS exploitation the likely path in many incidents.
- Application infrastructure software forms a significant secondary tier.
- Routers and IaaS each contribute low but meaningful single digits, enough to justify specific controls.
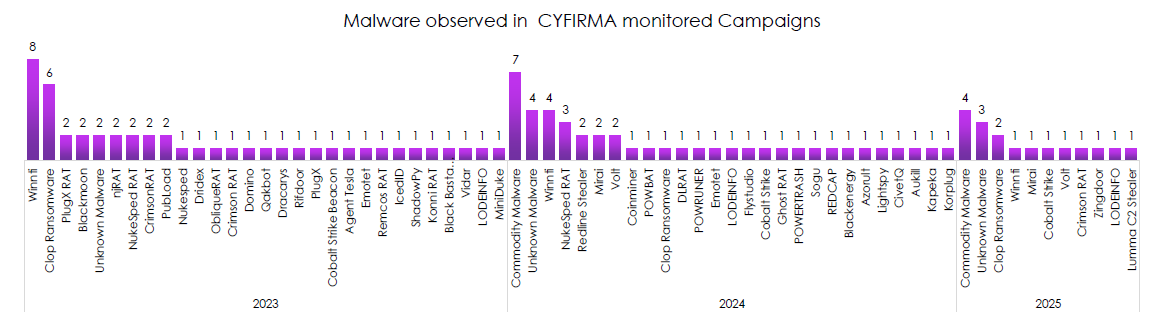
Malware Observed
CYFIRMA observed a mix of commodity loaders, RATs, and selective ransomware, with family rotations by year.
- 2023 shows notable activity for Clop ransomware alongside PlugX and multiple RATs, signaling both data theft and espionage operations.
- 2024 shifts to commodity malware as the modal category, with Whimti, NukeSped RAT, and RedLine Stealer showing up, matching broader affiliate activity and infostealer-driven access.
- 2025 YTD features Korplug and continued sightings of Clop, Mirai, and Cobalt Strike, a familiar toolkit for persistence and staging.
- The “Unknown malware” bucket remains material across years, consistent with private builds and quick variant churn.
RANSOMWARE
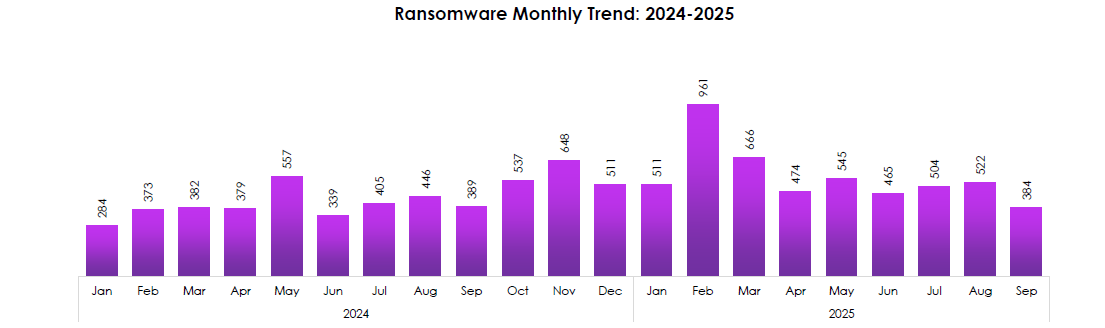
RANSOMWARE MONTHLY TREND (2024–2025)
CYFIRMA observed steady growth through 2024 with two clear surges and a sharp 2025 spike that resets the baseline.
- Volume rose from low 300s in early 2024 to peaks in May (557) and November (648), then cooled into December—classic pre-holiday lull after Q4 pushes.
- February 2025 is the outlier at 961, nearly double the late-2024 average. That kind of jump points to affiliate expansion, rebrands, and multi-victim bursts, not a single campaign.
- Post-spike, activity stabilizes in the ~465–545 band (Apr–Aug 2025). The “new normal” is higher than early-2024, meaning sustained pressure rather than a one-off event.
- June 2024 (339) and September 2025 (384) are troughs around enforcement waves and actor regrouping windows—use dip periods to burn down attack surface and patch debt.
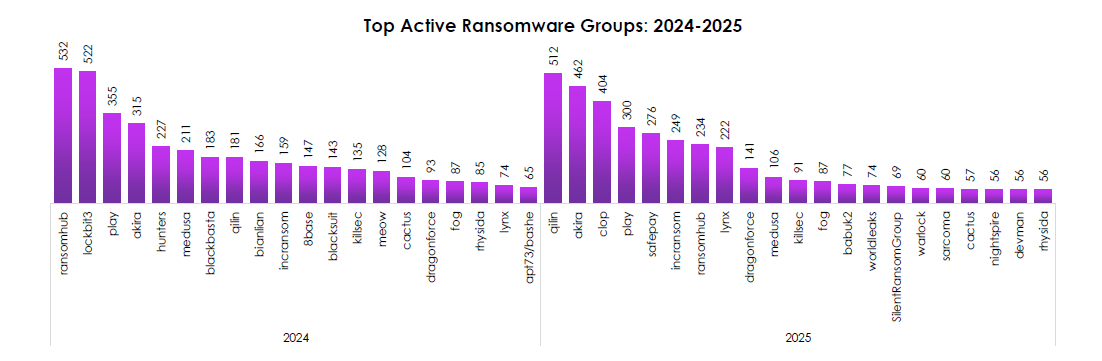
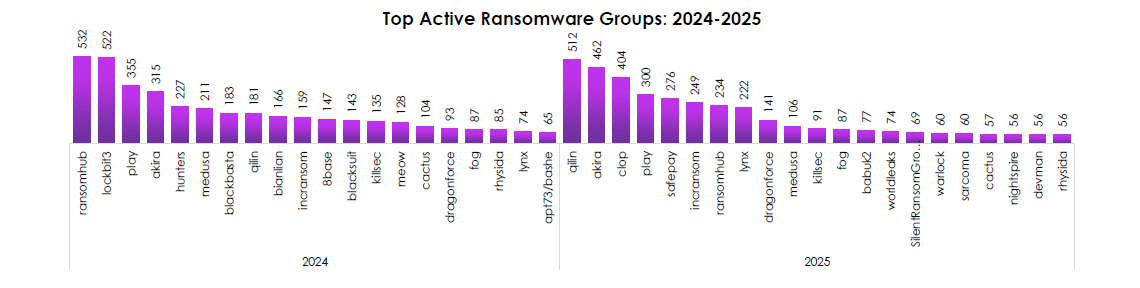
TOP ACTIVE RANSOMWARE GROUPS (2024–2025)
CYFIRMA observed leadership churn at the top, with a long tail of capable crews—evidence of a resilient franchise economy.
- 2024 leaders: RansomHub (532) and LockBit3 (522) set the pace, followed by Play (355) and Akira (315). Despite takedowns, ecosystem capacity refilled quickly.
- 2025 reshuffle: Qilin (512) and Akira (462) move into the lead; Clop (404) returns to form; Play (300) holds steady; RansomHub drops but remains active. Disruptions shift logos, not outcomes.
- Newer or resurgent names in 2025—SafePay, WorldLeaks, SilentRansomGroup, Warlock—signal fresh affiliate pools and tooling portability.
- Durable second-tier actors (IncRansom, Medusa, Lynx, DragonForce) provide continuity, ensuring steady baseline volume even when a top brand stumbles.
RANSOMWARE VICTIMS BY INDUSTRY (2024–2025)
CYFIRMA observed consistent focus on services, manufacturing, and consumer-facing sectors—high conversion targets with exploitable third-party dependencies.
- 2024: top hit sectors were Professional Services (892), Manufacturing (628), Consumer Goods & Services (624), Healthcare (565), and IT (485)—a mix that amplifies supply-chain reach.
- 2025: the order tilts—Consumer Goods & Services (706) takes the lead, Professional Services drops (667) but stays high; Manufacturing (625) and IT (560) remain stable; Healthcare falls to 391.
- Government & Civic rises from 296 (2024) to 254 (2025) while staying mid-pack—steady exposure with political sensitivity and high impact per incident.
- Materials, Construction, and Transportation/Logistics all notch meaningful counts in 2025, reflecting upstream supply and physical-ops leverage.
- Energy & Utilities show lower absolute counts (150 → 113), but risk remains asymmetric: fewer victims, higher potential impact. Don’t be fooled by volume alone.
RANSOMWARE TREND – INSIGHTS
CYFIRMA observed a durable, profit-driven ecosystem where actor churn and monthly spikes mask a stable operating model.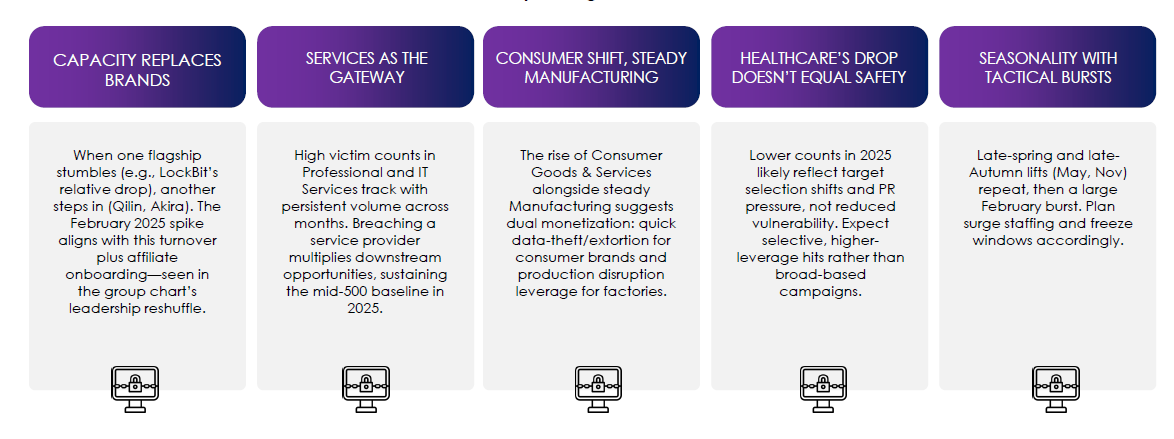
DARKWEB CHATTER TREND
Dark web chatter highlights rising threats to various industries .
Insights from DeCYFIR show early indicators of APT and cybercriminal interest in global infrastructure, which enables proactive defense by benchmarking threats against similar organizations.
Darkweb Chatter Trend by Industry
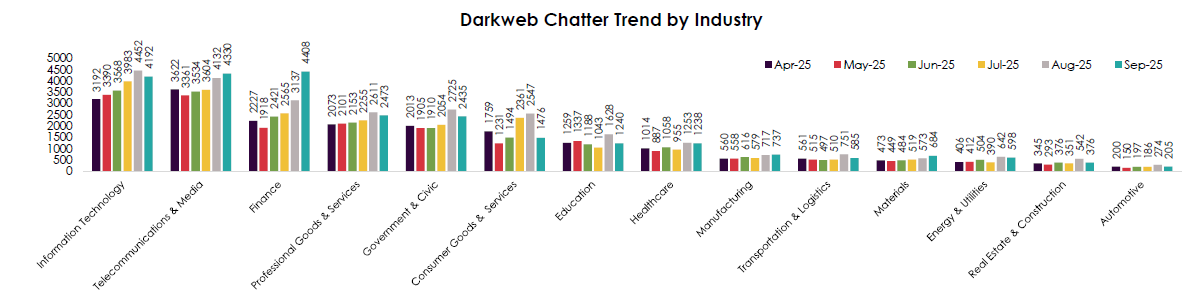
CYFIRMA observed sustained growth in darkweb conversations touching core digital supply chains, with sharp late-quarter lifts in Finance and public-sector–adjacent sectors.
- Information Technology and Telecom/Media lead every month, climbing into September (IT ~4.2K; Telco/Media ~4.3K). That’s consistent with actors discussing access, credentials, and exploits that pivot into many downstream customers.
- Finance jumps hard in September (~4.5K from ~3.1K in Aug)—the steepest single-month rise on the chart—suggesting fresh dumps, brokered access, or monetizable PII/PCI that attracts rapid attention.
- Government & Civic spikes in August (~2.7K) and stays high, a pattern that typically tracks election cycles, policy events, or recent leaks that energize both criminals and ideologically motivated actors.
- Healthcare, Manufacturing, and Energy/Utilities trend upward into Sep, not huge volumes but steady growth—classic signals that operational data and OT-adjacent information are being traded or sought.
- Transportation/Logistics shows an August pop (≈750) then cools, mirroring seasonal shipping windows and actor interest in cargo and routing data.
- Consumer Goods & Services surges mid-summer (Jul–Aug) then drops, implying news-driven chatter around brand breaches and loyalty data that fades once monetized.
- Education rises into September (≈1.6K)—likely start-of-term account resale, student data, and campus IT exposures.
- Automotive and Real Estate remain low and flat, but any mention often relates to key supplier systems rather than OEMs themselves—watch the vendor chain.
Darkweb demand is coalescing around high-leverage suppliers (IT/Telco) and high-value data markets (Finance, Gov, Healthcare). Treat spikes as leading indicators of near-term targeting and fraud waves.
Darkweb Chatter Trend by Chatter Type
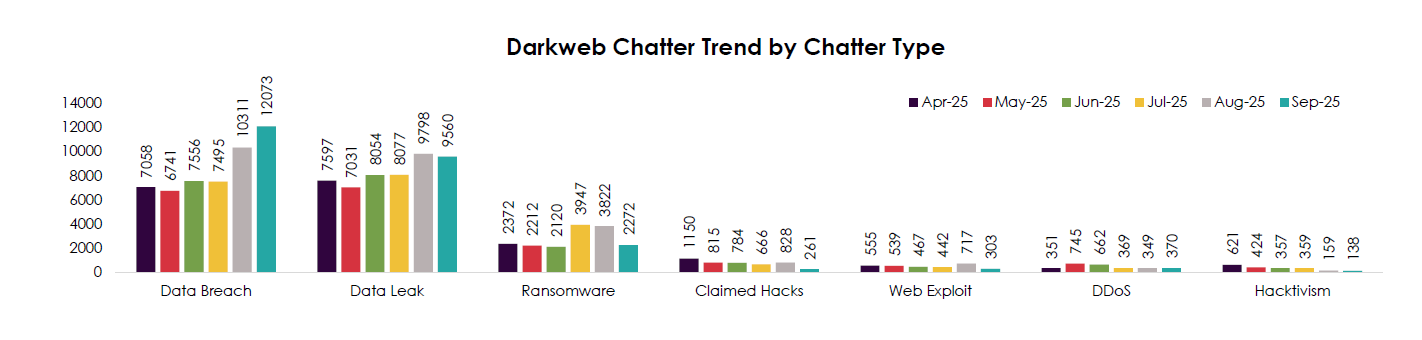
CYFIRMA observed an ecosystem shifting toward data monetization while “noise” categories decline.
- Data Breach chatter accelerates sharply Aug→Sep (~10.3K → ~12.1K); Data Leak also stays elevated (~9.6K). This is the dominant conversation—and the best predictor of credential abuse, fraud, and follow-on extortion.
- Ransomware chatter spikes mid-summer (Jul–Aug ~3.9K/~3.8K) then drops in Sep (~2.3K). This suggests periodic campaign pushes, but the sustained upside is now in data-centric trade, not just encrypt-and-extort.
- Claimed Hacks and Web Exploit mentions trend down all period, indicating fewer low-effort brag posts and more marketplace-style listings where stolen data is quickly priced and moved.
- DDoS is volatile with a May peak, but overall low compared to breaches—actors favor data and access over disruption unless paired with extortion.
- Hacktivism steadily declines (621 → 138), even as Gov chatter rises; ideologically framed posts are giving way to criminal resale of government-sourced data.
Expect more data exposure and fraud than “loud” attacks. Brand damage will come from leaks, not just lock-ups.
DARKWEB CHATTER TREND – INSIGHTS
CYFIRMA observed that the late-quarter surge in Data Breach/Data Leak chatter aligns with the September spikes in Finance and the sustained highs in IT and Telecom/Media. Here’s what that means:
- Supply chain leverage is the multiplier. High IT/Telco chatter plus elevated Gov/Finance indicates actors discussing access that scales across many tenants. One MSP exposure boosts risk for dozens of customers.
- Data is the product. With ransomware talk cooling in September while breach/leak chatter soars, the market is prioritizing sellable datasets (KYC, payroll, customer PII, credentials) over noisy encryption events.
- Finance is the immediate target of opportunity. The outsized September Finance jump suggests fresh breach disclosures or marketplace drops expect a near-term rise in account takeovers and payment fraud.
- Operational sectors are warming. Manufacturing, Energy/Utilities, Healthcare, and Education all trend up into Sep, matching an access-first model: harvest credentials/configs now, monetize later via extortion or vendor pivot.
- Less theater, more commerce. Falling “Claimed Hacks/Web Exploit/Hacktivism” chatter indicates a quieter, professionalized market—faster sales, fewer public boasts, tighter broker channels.
ASSET EXPOSURE & VULNERABILITIES
KNOWN EXPLOITED VULNERABILITIES (KEV)
Yearly KEV Trend (2023–2025)
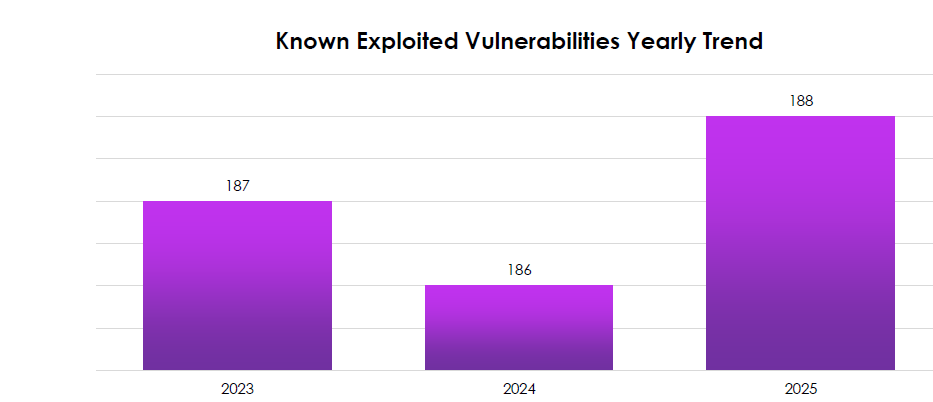
CYFIRMA observed a flat but persistently high yearly volume: 187 (2023) → 186 (2024) → 188 (2025).
- Stability at the top line means exploitation hasn’t slowed, actors keep pace with vendor patching and disclosure cycles.
- 2025 edges up slightly, suggesting no benefit from takedowns or publicity; KEV is a durable operating model.
- Year-over-year similarity implies attackers optimize for reach and reliability (widely deployed products, easy entry paths) rather than novelty.
- Treat the plateau as a floor, not a ceiling; quarterly surges (next chart) drive real risk.
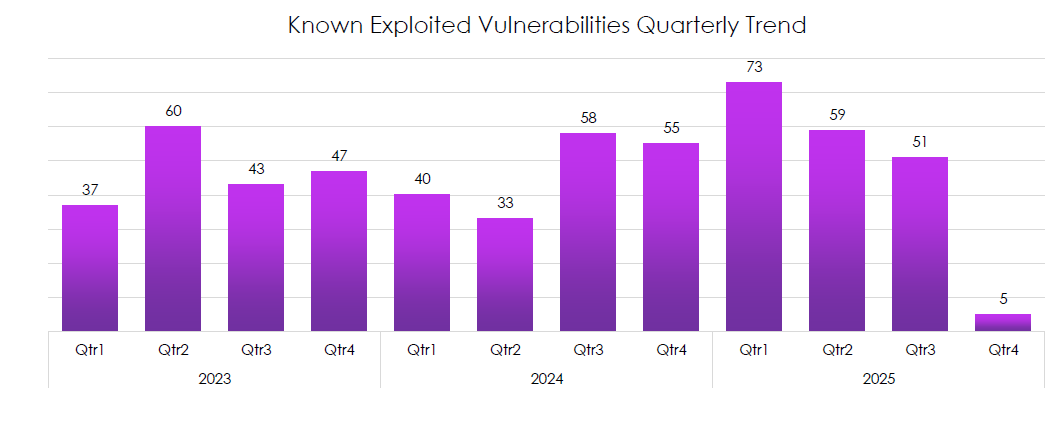
QUARTERLY KEV TREND (Q1 2023–Q4 2025)
CYFIRMA observed pronounced spikes and mid-year waves: Q1-2025 peaks at 73, followed by Q2-2025 (59) and Q3-2025 (51); Q4-2025 (5) is partial.
- Spikes recur around Q2–Q3 2024 (58/55) and Q1 2025 (73)—classic patterns tied to major zero-days and edge-device flaws.
- 2023 showed Q2 (60) as the high—reinforces a multi-year mid-year rise.
- After each spike, volume settles at a higher baseline; defenders inherit residual exposure from slow-to-patch assets.
- The Q1-2025 jump is the cycle’s standout—expect similar shock events to recur; pre-approve emergency changes to move within 72 hours of KEV listing.
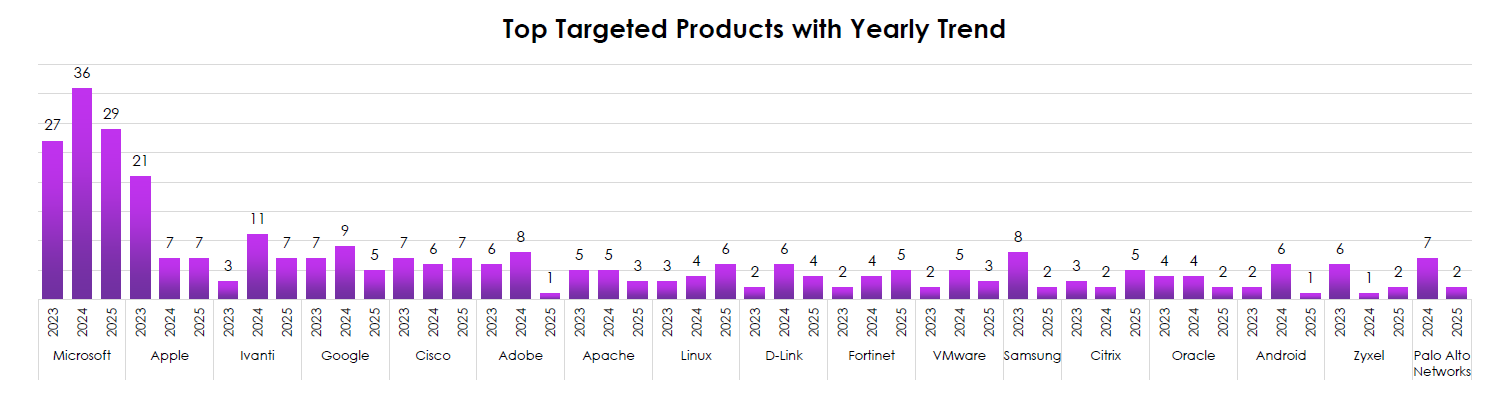
TOP TARGETED PRODUCTS WITH YEARLY TREND (PER VENDOR, 2023–2025)
CYFIRMA observed concentration on Microsoft at scale, a 2025 jump on Apple, and recurring hits on edge and management tooling.
- Microsoft: consistently highest (27 → 36 → 29); ubiquity keeps it the prime pathway for both crime and state activity.
- Apple: rises sharply in 2025 (21) after low 2023–2024, tracking active exploitation in iOS/macOS—expect more mobile/endpoint-first campaigns.
- Ivanti: spikes in 2024 (11) and remains material in 2025—exposed management servers are repeatably useful.
- Networking/edge vendors (Cisco, Fortinet, D-Link, Palo Alto, Zyxel, Citrix): appear across all years; several show one-year surges (e.g., D-Link in 2024, Palo Alto in 2024, Fortinet rising in 2025), signaling opportunistic perimeter exploitation.
- Google, Linux, Apache, Adobe, VMware: steady, mid-tier exploitation—supply-chain and server-side software keep the door open even without headlines.
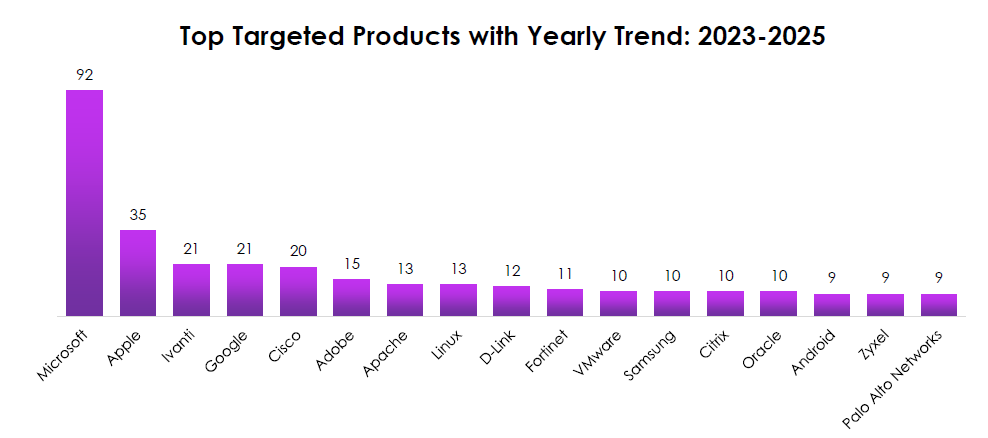
TOP TARGETED PRODUCTS (AGGREGATE TOTALS, 2023–2025)
CYFIRMA observed a steep drop-off after Microsoft, then a dense mid-pack of widely deployed platforms.
- Microsoft dominates (92)—dwarfs the field; any delay on Microsoft KEVs multiplies risk.
- Apple (35) is the clear #2—mobile and macOS now matter for enterprise attack paths, not just consumer devices.
- Tight cluster (Ivanti 21, Google 21, Cisco 20, Adobe 15, Apache 13, Linux 13, D-Link 12, Fortinet 11, VMware/Samsung/Citrix/Oracle 10, Android/Zyxel/Palo Alto 9): this is your control plane—identity, browsers, hypervisors, and edge.
- The mix skews toward perimeter and endpoint adjacency, explaining the fast weaponization cycle seen in the quarterly spikes.
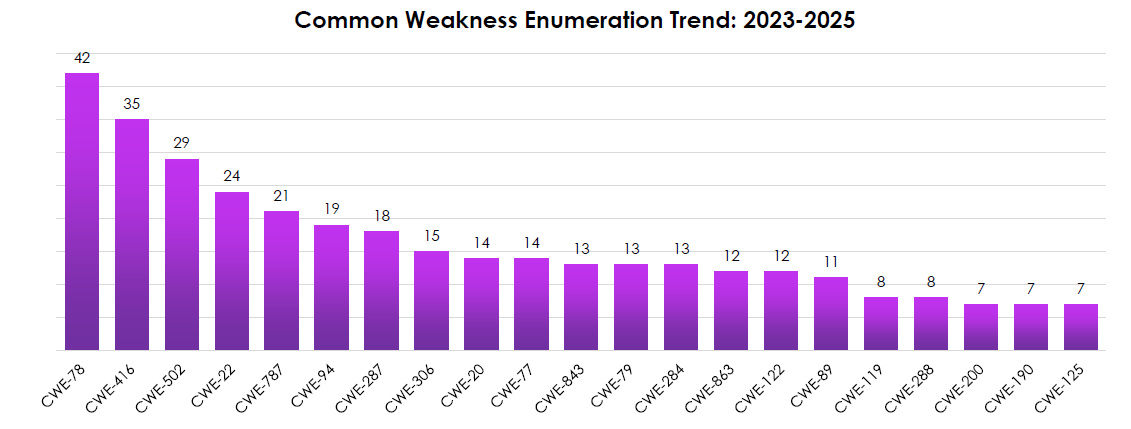
COMMON WEAKNESS ENUMERATION (CWE) TREND (TOP CATEGORIES, 2023–2025)
CYFIRMA observed exploitation anchored in remote code execution and memory-safety flaws, with classic web abuses still present.
- CWE-78 (OS command injection) leads (42)—attackers favor simple, reliable RCE on network appliances and web apps.
- Memory safety issues dominate next: CWE-416 (use-after-free, 35) and CWE-787 (out-of-bounds write, 21)—browser/OS/driver surfaces remain lucrative.
- CWE-502 (deserialization, 29) and CWE-22 (path traversal, 24) show steady server-side exploitation in app frameworks and middleware.
- Auth/Access errors (e.g., CWE-287, 306, 284) stay material—privilege bypass remains a practical route when RCE isn’t available.
- Injection/validation issues (CWE-94 code injection, 19; CWE-79 XSS, 13; CWE-89 SQLi, 11) persist, sustaining initial access and data theft at scale.
KNOWN EXPLOITED VULNERABILITIES (KEV): INSIGHTS
CYFIRMA observed that quarterly spikes line up with vendor-specific surges and the CWE mix:
- The Q1-2025 peak (73) aligns with increased exploitation in Apple and continuing activity on Microsoft and edge vendors—a blend of mobile/endpoint and perimeter RCE.
- 2024 mid-year waves (Q3/Q4) track with D-Link/Palo Alto/Ivanti surges, matching CWE-78/502 patterns typical of appliance and middleware flaws.
- The vendor spread plus CWE profile confirms attacker preference for high-reach RCE on devices that are hard to patch fast (appliances, MDM/IT tools), then pivot via auth/logic weaknesses.
- Yearly stability with quarterly volatility tells you the threat budget is constant, but risk crystallizes in bursts when patch friction meets weaponized PoCs.