

The CYFIRMA Industries Report delivers original cybersecurity insights and telemetry-driven statistics of global industries, covering one sector each week for a quarter. This report focuses on the automotive industry, presenting key trends and statistics in an engaging infographic format.
Welcome to the CYFIRMA infographic industry report, where we delve into the external threat landscape of the automotive industry over the past three months. This report provides valuable insights and data-driven statistics, delivering a concise analysis of attack campaigns, phishing telemetry, and ransomware incidents targeting the automotive organizations.
We aim to present an industry-specific overview in a convenient, engaging, and informative format. Leveraging our cutting-edge platform telemetry and the expertise of our analysts, we bring you actionable intelligence to stay ahead in the cybersecurity landscape.
CYFIRMA provides cyber threat intelligence and external threat landscape management platforms, DeCYFIR and DeTCT, which utilize artificial intelligence and machine learning to ingest and process relevant data, complemented by manual CTI research.
For the purpose of these reports, we leverage the following data from our platform. These are data processed by AI and ML automation based on both human research input and automated ingestions.
While this report contains statistics and graphs generated primarily by automation, it undergoes thorough review and enhancement for additional context by CYFIRMA CTI analysts to ensure the highest quality and provide valuable insights.
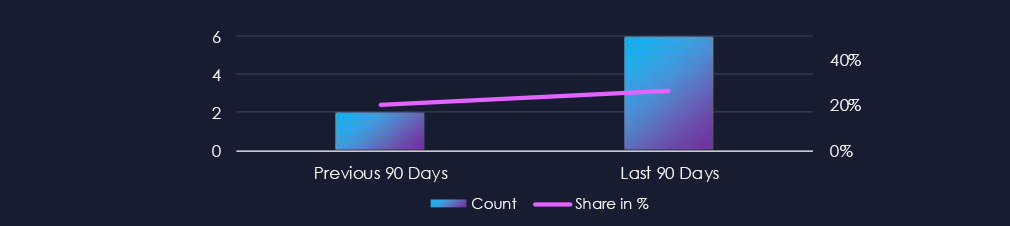
Automotive industry over past 90 days featured in 6 out of the 23 observed campaigns, which is a presence in 26% of all campaigns. That is a major increase from the previous 90 days, however just a mild growth in overall share from 20% (2 out of 10).

Most of the campaigns were observed during late July. August and September also recorded one each.
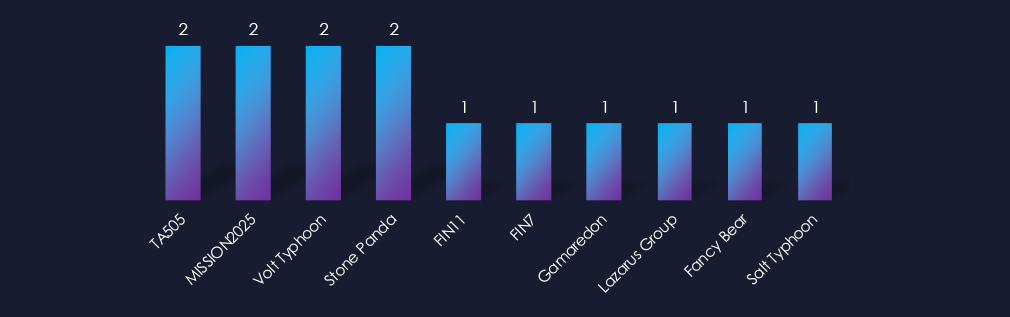
Observed campaigns are primarily divided among Russian cybercrime syndicates FIN7, FIN11, and TA505. These groups share overlapping tactics and procedures (TTPs) with Fancy Bear and Gamaredon. Additionally, there’s a Chinese Ministry of State Security-linked group with overlapping TTPs that suggest involvement in Salt Typhoon and Stone Panda. Furthermore, we’ve observed Volt Typhoon and the North Korean Lazarus Group.
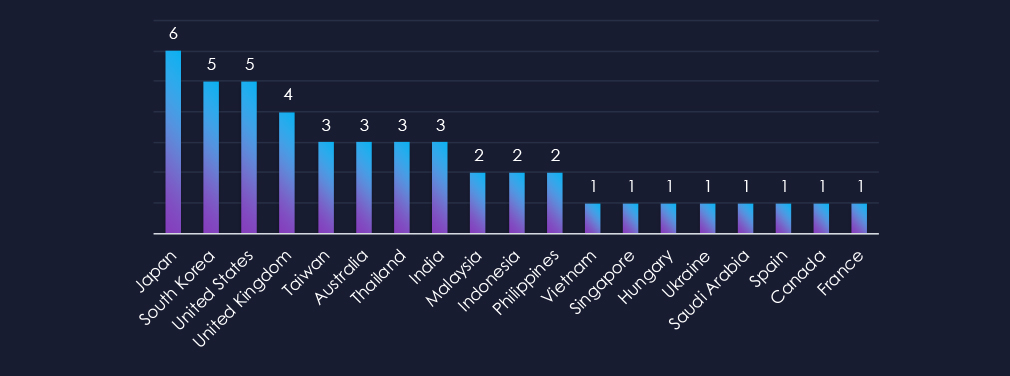
Countries with recorded victims align strongly with known automotive powerhouses. Japan, South Korea and United States are top 3.
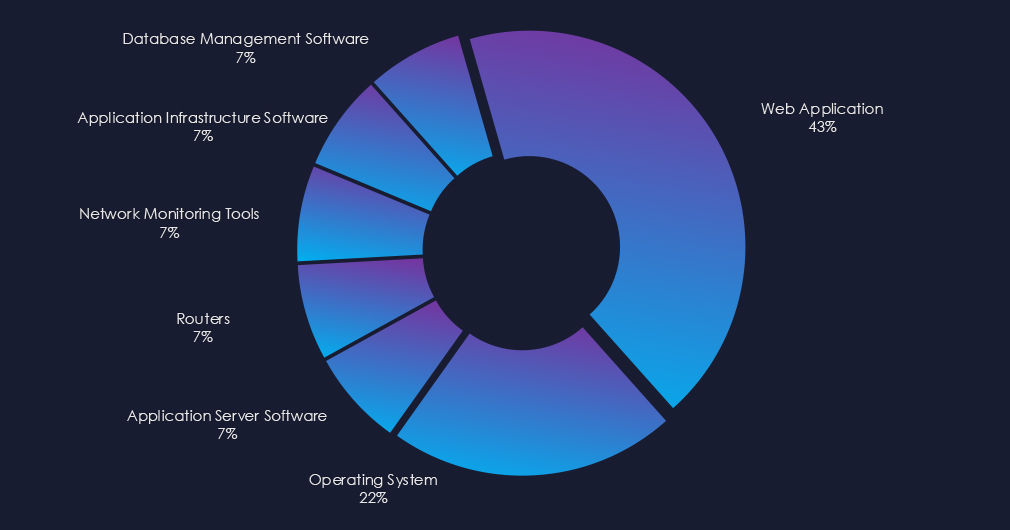
Campaigns targeted mostly web applications and operating systems. Chinese campaign also attacked routers and network monitoring tools.

Over the past 90 days, 6 out of the 23 observed APT campaigns targeted this industry, representing 26% of the observed campaigns. This is an increase from the previous 90-day period, during which only 2 campaign targeted this industry. However only mild increase from overall share of 20% (2 out of 10 campaigns)
Monthly Trends
4 campaigns were observed during late July. August and September then recorded one campaigns each.
Key Threat Actors
Most of the campaigns were carried out by Russian cybercrime syndicates and groups linked to the Chinese Ministry of State Security (MSS). The techniques used in these campaigns are overlapping and suggest a connection to Stone Panda and Salt Typhoon. There were also Volt Typhoon and North Korean Lazarus Group campaigns.
Geographical Impact
Campaigns focused on known automotive nations. Japan, South Korea and the US were top 3 attacked countries.
Targeted Technologies
Web applications and operating systems were the most frequent targets. The Chinese campaign also targeted routers and network monitoring tools among other management software.
Over the past three months, CYFIRMA’s telemetry has identified 672 mentions of automotive industry out of a total of 74,424 industry mentions. This is from total of 300k+ posts across various underground and dark web channels and forums.
Automotive industry placed 14th out of 14 industries in last 90 days with share of 0.90% of all detected industry-linked chatter. Important to note is the narrow scope of automotive industry category.
Below is a breakdown by 30 days periods of all mentions.
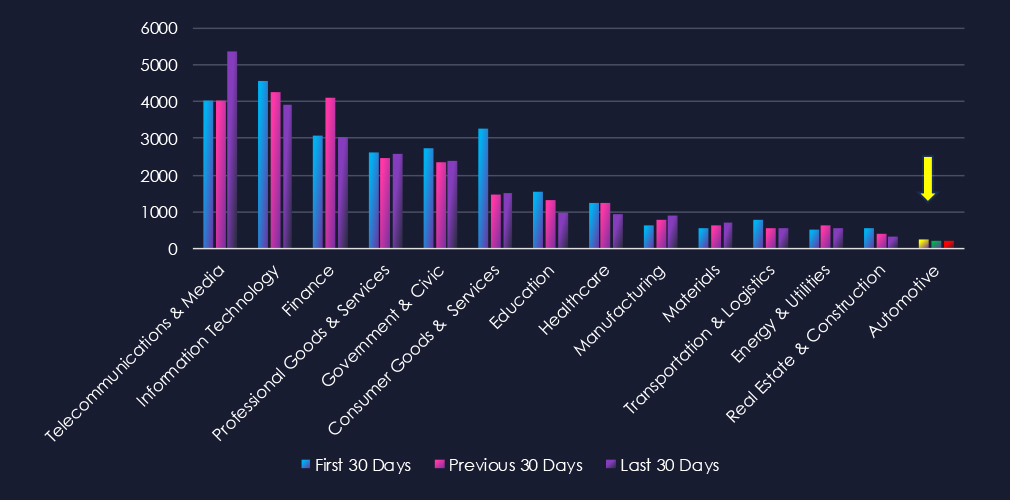
Data leaks and data breaches are the most frequently mentioned topics in this industry. While ransomware chatter has persisted, it has gradually decreased over the course of the 90-day period. Additionally, claims of hacks, hacktivism, and web exploits have also shown a decline.

In total, automotive industry comprise 0.90% of all detected industry underground and dark web chatter in the last 90 days. And ranking 14th out of 14 industries.
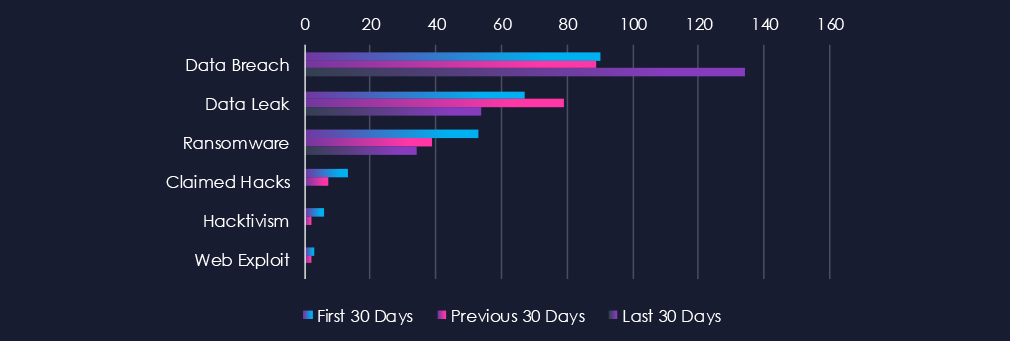
Below are observed key trends across 90 days:
Data Breach
90 → 89 → 134, Noticeable jump in the latest period after stable early activity. Indicates renewed targeting of automotive companies, likely focused on corporate networks, design data, or connected vehicle platforms. The increase also reflects recent high profile incidents.
Data Leak
67 → 79 → 54, Moderate decline after a brief mid-period rise. Suggests fewer data exfiltration or resale incidents recently, possibly as operations became more covert or data monetization shifted toward private channels.
Ransomware
53 → 39 → 34, Steady downward trend. May indicate improved resilience in automotive manufacturing networks or reduced profitability for attackers compared to other sectors. Still, ongoing exposure remains possible through suppliers and connected manufacturing systems.
Claimed Hacks
13 → 7 → 0, Sharp drop to none reported in the latest period. This may point to fewer successful intrusions or a move toward quieter, access-for-sale models instead of public bragging.
Hacktivism
6 → 2 → 0, Rapid decline to inactivity. Suggests minimal ideological or politically motivated targeting of automotive firms at present.
Web Exploit
3 → 2 → 0, Low and diminishing. Indicates few reported attempts to exploit web-facing automotive assets, perhaps due to strengthened defences or a shift toward internal and partner-targeted intrusions.
Over the past three months, CYFIRMA’s telemetry has identified 21 mentions of automotive industry out of a total of 2,916 industry mentions. This is from over 10k CVEs reported and updated in last 90 days.
Automotive industry ranked 14th out of 14 industries in last 90 days with share of 0.72% of all detected industry linked vulnerabilities.
Below is a breakdown by 30 days periods of all mentions.
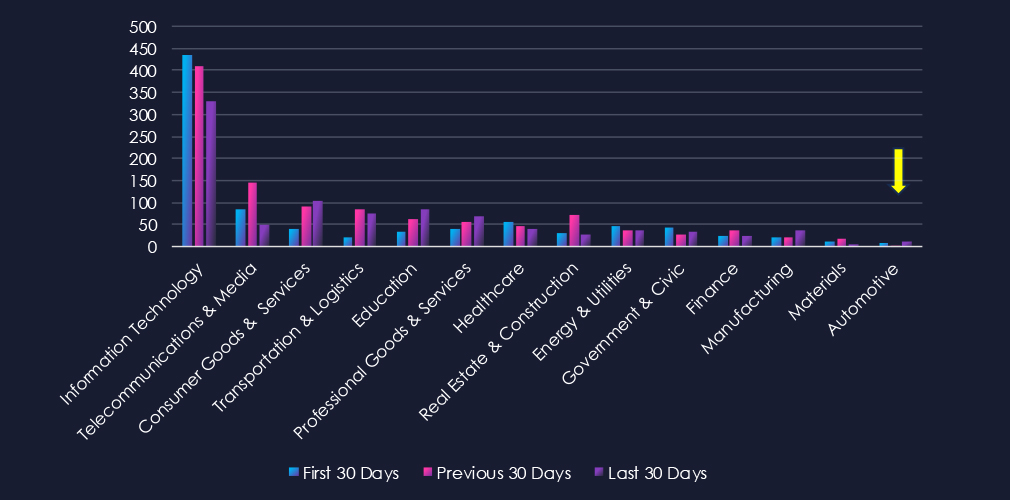
Injection attacks are leading the chart, however there were none during previous 30 days. Remote & Arbitrary Code Execution (RCE & ACE) and Information Disclosure & Data Leakage follow. Remaining categories are minimal, but even single vulnerability can be critical.

In total, automotive industry comprise of 0.72% of all detected industry-linked vulnerabilities in the last 90 days. And ranking 14th out of 14 industries.
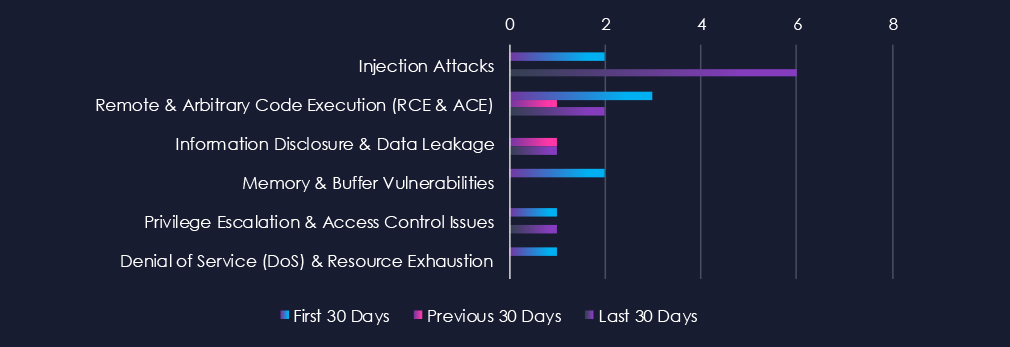
Below are observed key trends across 90 days.
Injection Attacks
2 → 0 → 6, A sharp rise in the latest period after low reporting previously. This uptick likely reflects renewed researcher focus on automotive software interfaces, APIs, and connected vehicle systems, where improper input handling can expose critical functions.
Remote & Arbitrary Code Execution (RCE & ACE)
3 → 1 → 2, Moderate and consistent reporting of high-severity flaws. While not abundant, these vulnerabilities represent significant risk given their potential to impact vehicle firmware, telematics platforms, or back-end management systems.
Information Disclosure & Data Leakage
0 → 1 → 1, Low but steady activity, indicating occasional findings related to inadvertent exposure of sensitive data, possibly within connected car ecosystems or backend applications.
Memory & Buffer Vulnerabilities
2 → 0 → 0, Decline to zero in recent periods. This drop may indicate limited ongoing focus on legacy embedded systems, or that earlier identified issues have already been mitigated through vendor patching.
Privilege Escalation & Access Control Issues
1 → 0 → 1, Minimal but persistent reporting. Suggests occasional discoveries of access control weaknesses, which may arise from misconfigurations in automotive diagnostic or telematics software.
Denial of Service (DoS) & Resource Exhaustion
1 → 0 → 0, No recent disclosures, pointing to low research emphasis on service availability issues within the sector.
In the past 90 days, CYFIRMA has identified 36 verified ransomware victims in automotive industry. This accounts for 2.1% of the overall total of 1,691 ransomware victims during the same period. Placing automotive industry 14th out of 14 industries.
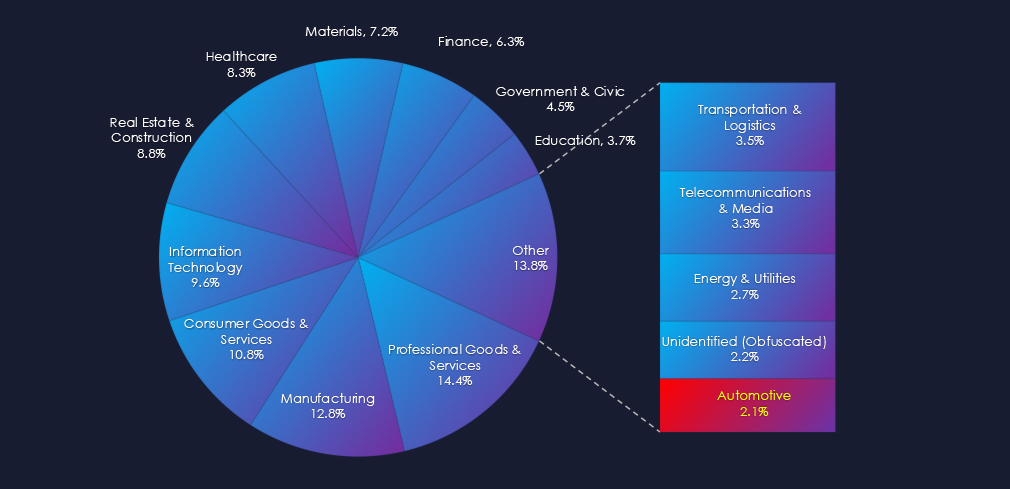
Furthermore, a quarterly comparison reveals sustained levels of interest in automotive organizations with only minor change of +2.9% from 35 to 36 victims. The overall share however mildly declined from 2.43% to 2.13% of all victims.
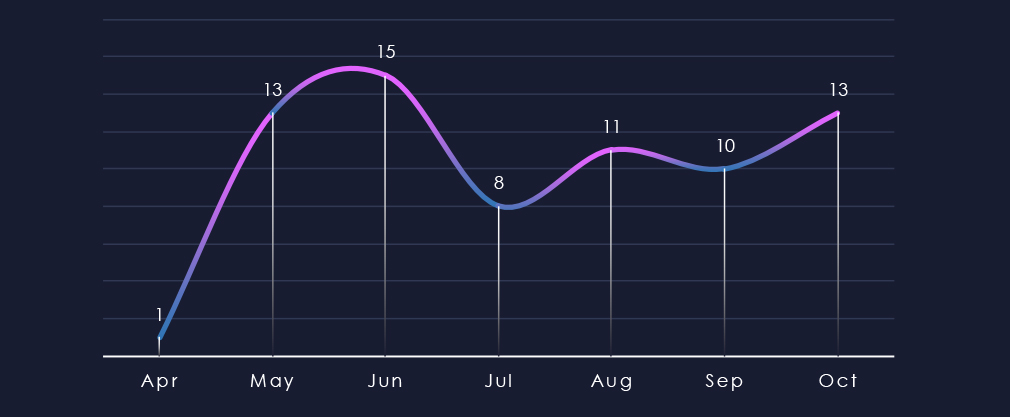
Over the past 180 days, we have observed one early bump in activity during May and June. After lower activity in July we see slowly growing trend again.
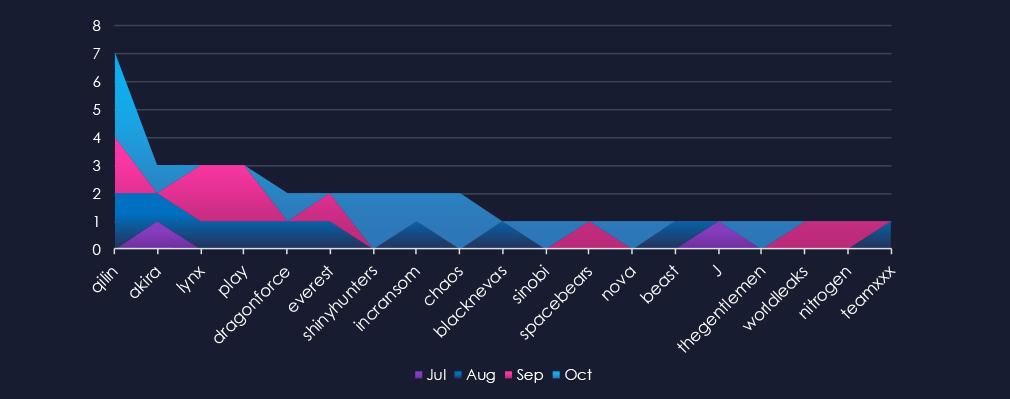
A breakdown of monthly activity per gang reveals which gangs were active each month. For instance, the most active gangs, Qilin and Akira, were highly active throughout the months. However, Qilin did not have any victims in July, while Akira did not record any in September. On the other hand, gangs like ShinyHnters or Chaos were only active during October.
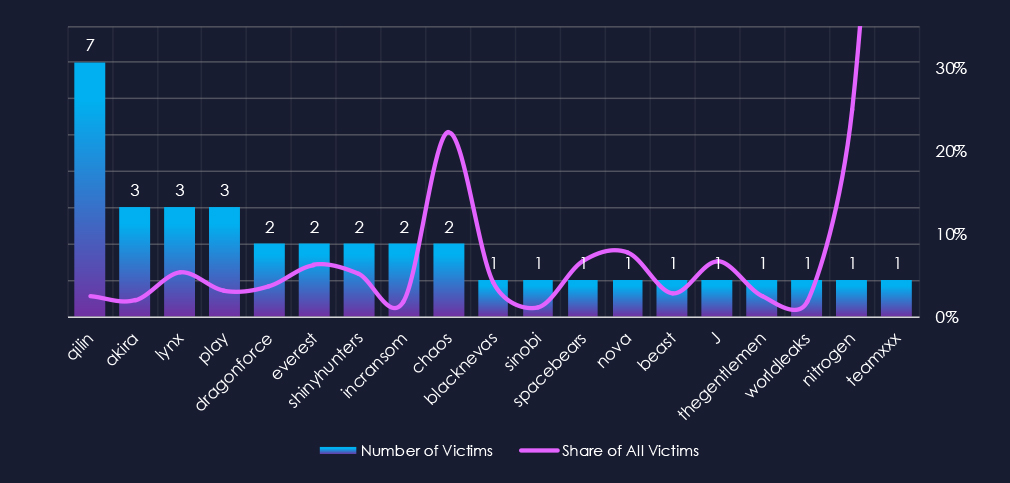
Out of the 75 gangs, only 19 recorded victims in this industry in the last 90 days (25% participation). Qilin had the highest number of victims (7).
The share of victims for most gangs in this industry is low. From the top 10, only one gang recorded a major share of their victims – Chaos (22.2%).
Among the top gangs, Lynx (5.4%), Everest (6.3%), and ShinyHunters (5.1%) had the highest share of victims; the rest is deep below the 5% mark. TeamXXX recorded 100% share but with only 1 out of 1 victims, hence skewing the scale.
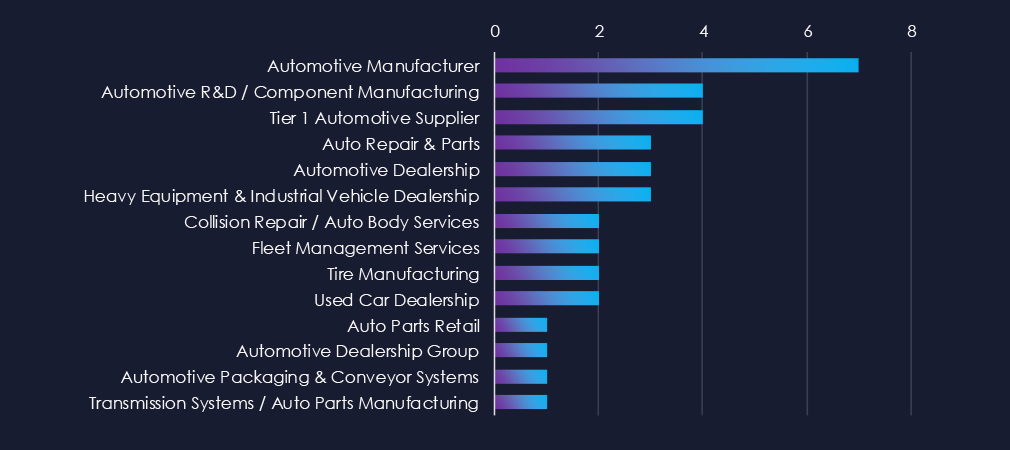
Manufacturers are leading the charts this time around. In previous reports dealerships were usually the top sectors.
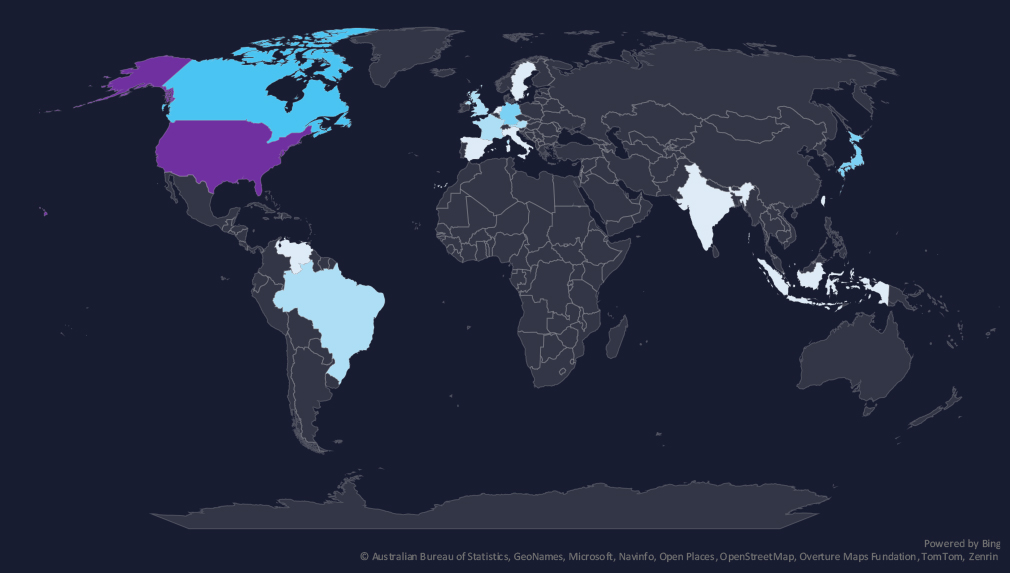
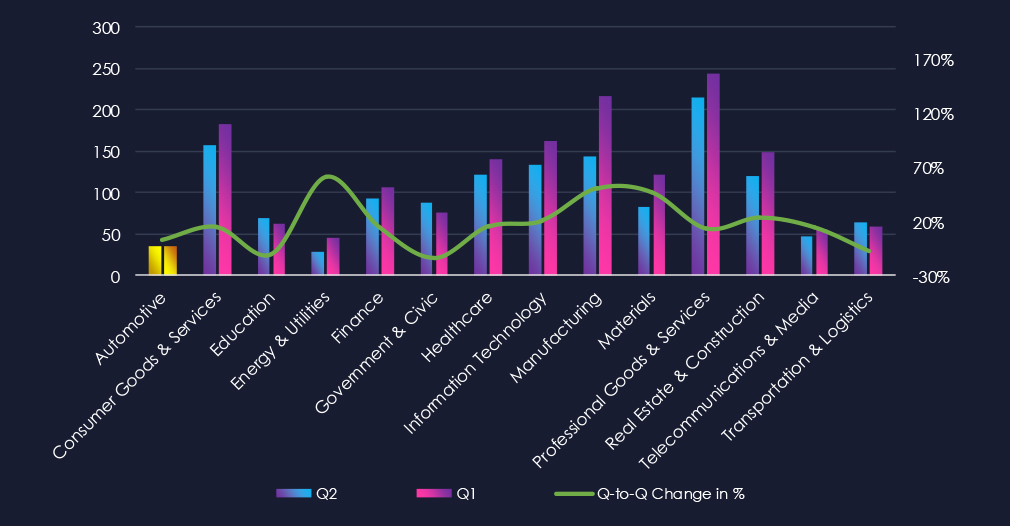
The geographic distribution heatmap underscores the widespread impact of ransomware, highlighting the countries where victims in this industry have been recorded.
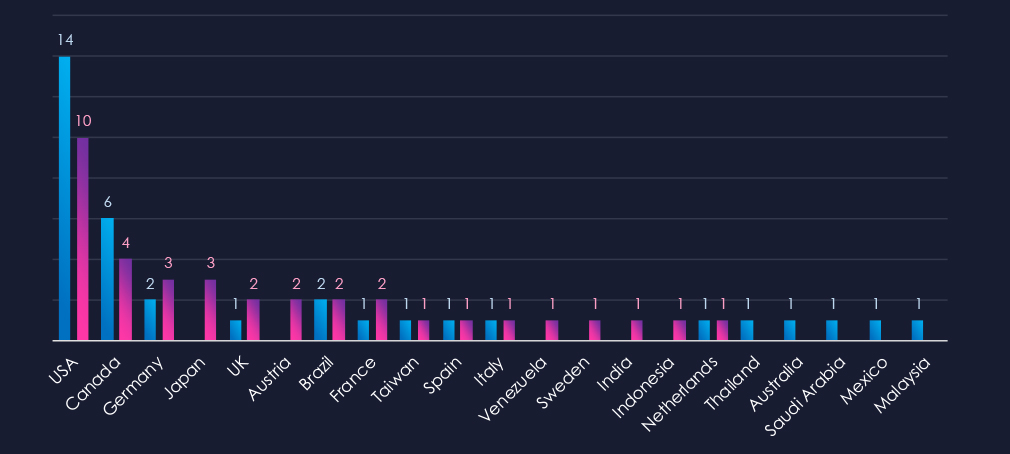
Chart shows quarter-to-quarter changes in targeted countries. Data is sorted by the last 90 days and compared to the previous 90 days, marked in blue.
In the last 90 days, the USA recorded 10 victims (28% of all victims). That is major shift from usually half of victims being form the USA. Notably Japan and Austria recorded increase in victims in last 90 days. Furthermore, Venezuela, Sweden, India and Indonesia recorded new victims.

Automotive industry placed 14th out of 14 monitored industries recording 36 victims in last 90 days. Only marginal increase of 2.9% from 35 victims in previous 90 days period.
Overall share however mildly declined from 2.43% to 2.13% of all ransomware victims.
In last 90 days we observed a shift from dealerships being most frequent victims to manufacturing taking the top spot.
Monthly Activity Trends
After spike of activity in May and Jun there was a dip in activity in July. Since then, activity grew mildly.
Ransomware Gangs
A total of only 19 out of 75 active ransomware groups targeted the this industry in the past 90 days – 25% participation:
Qilin: The most active with 7 victims and 2.4% (7 out of 293) of all their victims.
Akira, Lynx, Play: Second most active with 3 victims and just 2.0%, 5.4% and 3.1% shares of victims respectively.
Chaos: Highest shares of 22.2% (2 out of 9) victims among top 10 gangs.
Geographic Distribution
The geographic distribution of ransomware victims is relatively low and shifting away from the USA (10) accounting only for 28% of all victims on this period.
Followed by Canada (4), Japan and Germany (3). Notably Austria recorded 2 victims.
In total, only 16 countries recorded ransomware victims in this industry in last 90 days, three more than 13 in previous period.
For a comprehensive, up-to-date global ransomware tracking report, please refer to our new monthly “Tracking Ransomware” series here.
APT Campaigns (Low): The automotive sector saw limited but rising APT activity in the past 90 days, with 6 of 23 campaigns (26%) targeting it—an increase from 2 in the prior period. Most campaigns occurred in late July, with single events in August and September. Russian cybercrime groups and Chinese MSS-linked operators (notably Stone Panda and Salt Typhoon) were most active, joined by Volt Typhoon and Lazarus Group. Activity focused on major automotive economies such as Japan, South Korea, and the United States. Targeted technologies included web applications, operating systems, routers, and network monitoring tools, indicating a mix of IT and operational infrastructure exploitation.
Underground & Dark Web Chatter (Low): The automotive sector generated minimal underground chatter (0.9% share, 14th of 14 industries). Data breaches rose sharply in the latest period (134 from 90), reflecting renewed targeting of automotive manufacturers and suppliers, likely linked to high-profile incidents involving design or connected vehicle data. Data leaks declined, while ransomware and hacktivism fell steadily, suggesting lower public exposure but continued background risk. Claimed hacks dropped to zero, consistent with attackers favoring private access sales. Web exploit chatter also disappeared, possibly due to improved perimeter defenses and hardened OEM networks.
Vulnerabilities (Low): Automotive ranked last (14th) for industry-linked vulnerabilities, with only 0.72% of all reports. However, injection vulnerabilities rose significantly (2 → 6), showing renewed researcher focus on connected car and telematics systems. RCE/ACE disclosures remained steady, representing ongoing high-impact risks for firmware and backend management systems. Information disclosure and privilege escalation reports were minimal but recurring, tied to diagnostic and telematics platforms. Memory and DoS vulnerabilities declined to zero, suggesting fewer discoveries in legacy systems or improved patching within embedded components.
Ransomware (Low): Ransomware incidents remained stable, with 36 victims (+2.9%) but a smaller overall share of global activity (2.13%). The industry ranked last among all sectors. A shift was observed from dealership to manufacturing targets, reflecting evolving threat priorities. Qilin was the most active group (7 victims), followed by Akira, Lynx, and Play, each with smaller shares. Chaos showed the highest proportional focus, with over 22% of its total victims in this sector. The USA accounted for 28% of cases (10 victims), followed by Canada (4), Japan and Germany (3 each), and Austria (2). In total, 16 countries were affected, three more than in the prior period.