
The CYFIRMA Industry Report delivers original cybersecurity insights and telemetry-driven statistics of global industries, covering one sector each week for a quarter. This report focuses on the energy & utilities industry, presenting key trends and statistics in an engaging infographic format.
Welcome to the CYFIRMA infographic industry report, where we delve into the external threat landscape of the energy & utilities industry over the past three months. This report provides valuable insights and data-driven statistics, delivering a concise analysis of attack campaigns, phishing telemetry, and ransomware incidents targeting the energy & utilities organizations.
We aim to present an industry-specific overview in a convenient, engaging, and informative format. Leveraging our cutting-edge platform telemetry and the expertise of our analysts, we bring you actionable intelligence to stay ahead in the cybersecurity landscape.
CYFIRMA provides cyber threat intelligence and external threat landscape management platforms, DeCYFIR and DeTCT, which utilize artificial intelligence and machine learning to ingest and process relevant data, complemented by manual CTI research.
For the purpose of these reports, we leverage the following data from our platform. These are data processed by AI and ML automation, based on both human research input and automated ingestions.
While this report contains statistics and graphs generated primarily by automation, it undergoes thorough review and enhancement for additional context by CYFIRMA CTI analysts to ensure the highest quality and provide valuable insights.
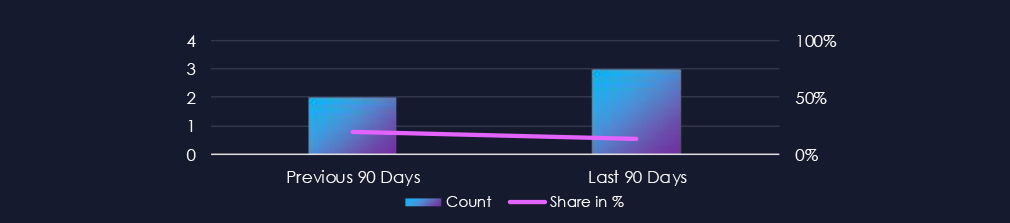
The energy & utilities industry featured in 3 out of the 22 observed campaigns, which is a presence in 14% of all campaigns, an increase from the previous period (2 out of 10, 20%) in volume but not in overall share.
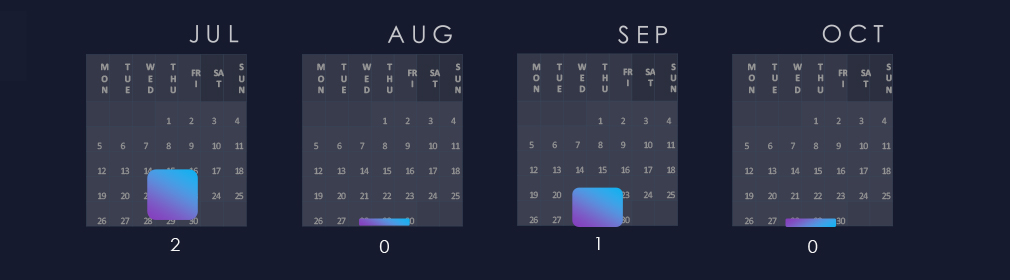
Activity is sporadic across months. Two campaigns were detected in July and then one in September.
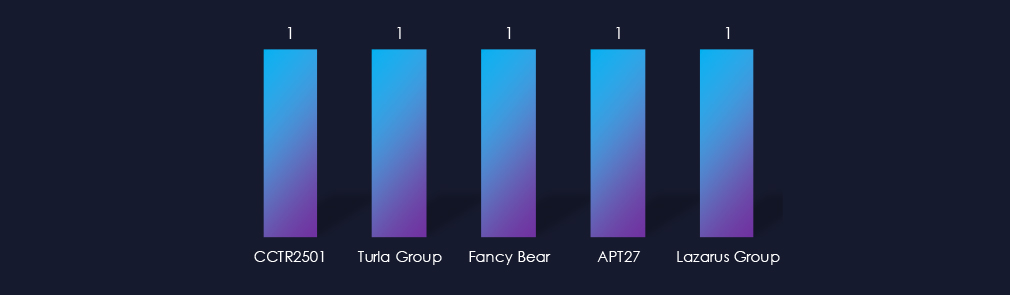
Observed campaigns were carried out by a mix of threat actors, CCTR2501 from Turkey, Russian Turla and Fancy Bear, Chinese APT27, and the North Korean Lazarus Group.
Campaigns targeted a relatively wide range of regions from Arabia to Asia to Europe to America.
Campaigns targeted a wide range of technologies, including Android phones, web apps, and SMTP.

Over the past 90 days, the energy & utilities industry has not been significantly impacted by advanced persistent threat (APT) campaigns. Only 3 out of 22 observed APT campaigns recorded victims in this industry. That is a 14% presence in observed campaigns.
This figure is a mild increase from the previous 90-day period, during which 2 campaigns targeted this industry.
Monthly Trends
The observed campaign was active during July and September, showing sporadic targeting.
Key Threat Actors
The campaigns were carried out by Turkish-speaking cybercriminal threat actors (CCTR2501), Russian Turla and Fancy Bear, Chinese APT27, and the North Korean Lazarus Group.
Geographical Impact
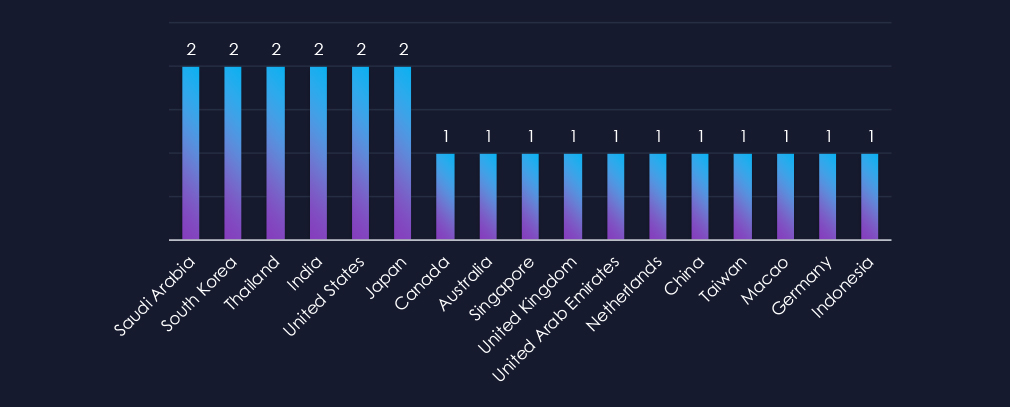
The campaigns affected a total of 17 countries. Higher focus was observed on Saudi Arabia, South Korea, Japan, Thailand, and India.
Targeted Technologies
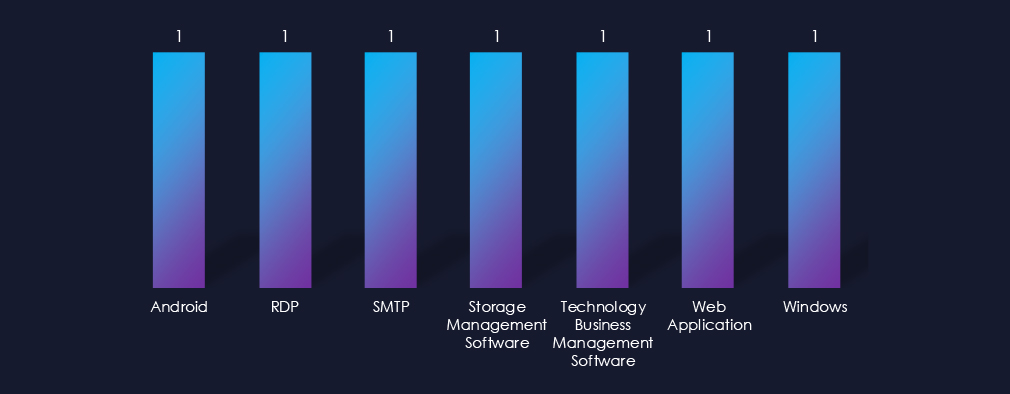
Observed campaigns exploited a wide range of technologies from Android phones to RDP or Storage management software, among others.
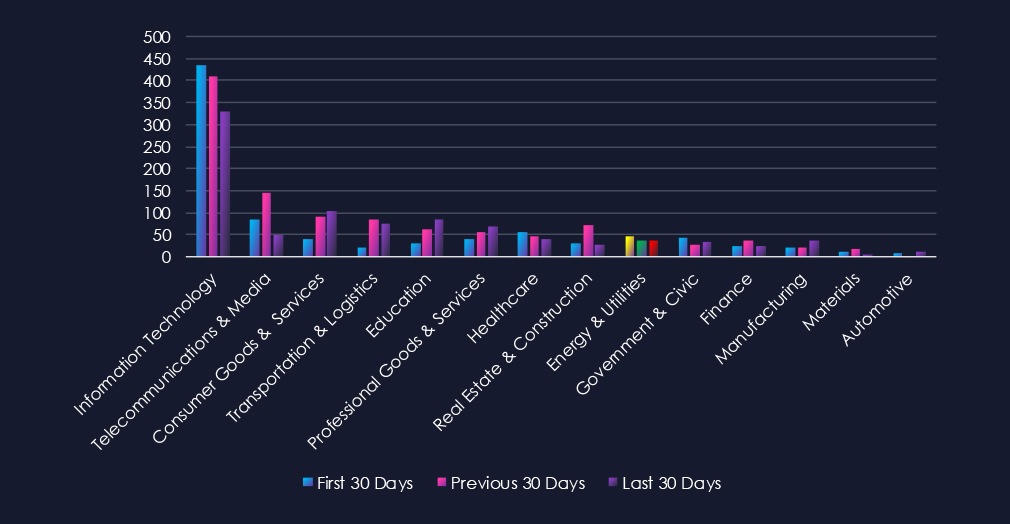
Over the past three months, CYFIRMA’s telemetry has identified 1,692 mentions of the energy & utilities industry out of a total of 74,424 industry mentions. This is from a total of 300k+ posts across various underground and dark web channels and forums.
The energy & utilities industry placed 12th out of 14 industries in the last 90 days, with a share of 2.27% of all detected industry-linked chatter.
Below is a breakdown by 30-day periods of all mentions.
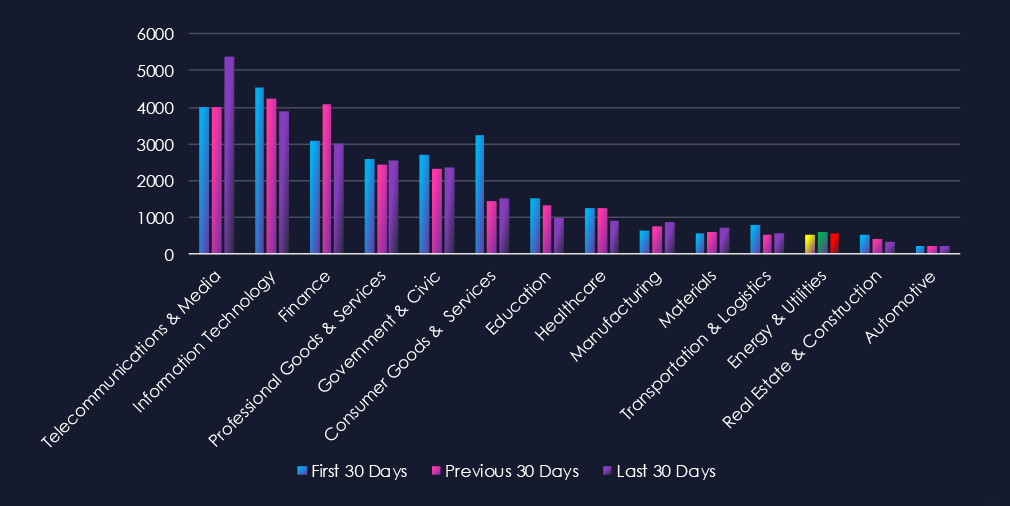
Data breaches and data leaks are the most frequently mentioned topics in this industry. Hacktivism, claimed hacks, and DDoS attacks have seen an increase in the past 30 days.
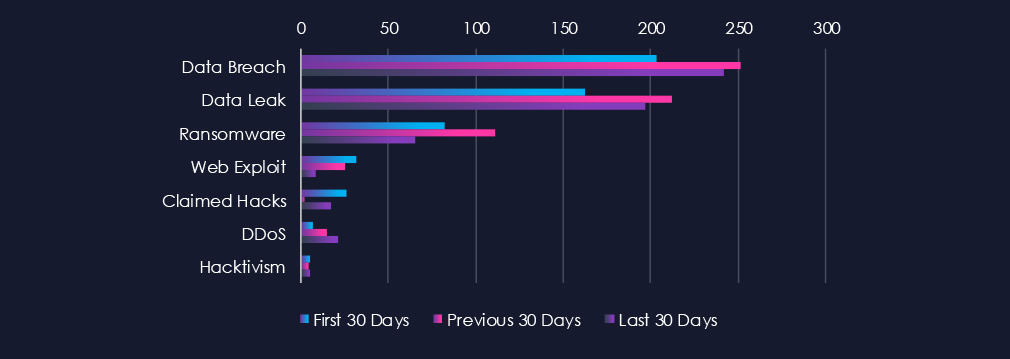
Below is a breakdown of underground & dark web chatter in the last 90 days:
Data Breach
203 → 251 → 242, Consistently high with a slight pullback in the latest period. Indicates ongoing, sustained targeting of energy providers and utilities, with threat actors likely focused on network access and data theft rather than large-scale disruption.
Data Leak
162 → 212 → 197, Follows a similar trajectory to breaches — elevated but stable. Reflects persistent exposure of sensitive operational or customer data, possibly from compromised vendor or partner systems within the energy supply chain.
Ransomware
82 → 111 → 65, Noticeable decline after a mid-period spike. Suggests a shift from overt encryption-based extortion to more covert data theft or access sales. It may also reflect improved resilience and response in critical infrastructure networks.
Web Exploit
32 → 25 → 8, Steady decline, likely signalling reduced focus on web-based entry points. Attackers may be shifting toward phishing, credential abuse, or supply chain vectors instead of direct web exploitation.
Claimed Hacks
26 → 2 → 17, A rebound in the latest period after a temporary lull. This renewed chatter could reflect publicity around smaller or regionally targeted intrusions, often used for leverage or propaganda rather than mass impact.
DDoS
7 → 15 → 21, Rising steadily and notably higher in the most recent period. Suggests an increase in disruption or extortion-motivated campaigns targeting energy sector entities, particularly as geopolitical tensions remain elevated.
Hacktivism
5 → 4 → 5, Stable at low levels. While not a dominant vector, ideological or politically motivated activity persists — often surfacing in conjunction with geopolitical flashpoints or critical energy discussions.
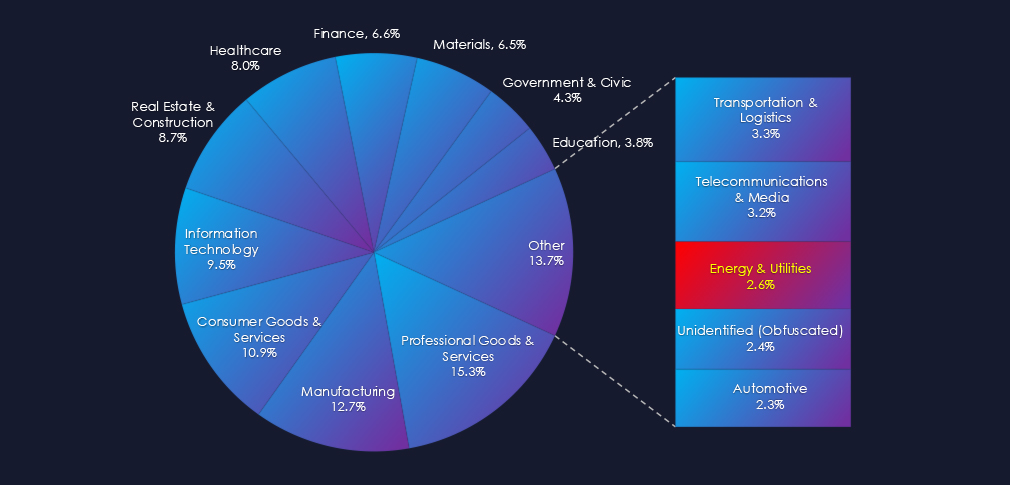
Over the past three months, CYFIRMA’s telemetry has identified 122 mentions of the energy & utilities industry out of a total of 2,916 industry mentions. This is from over 10k CVEs reported and updated in the last 90 days.
The energy & utilities industry ranked 9th out of 14 industries in the last 90 days, with a share of 4.18% of all detected industry-linked vulnerabilities.
Below is a breakdown by 30-day periods of all mentions.
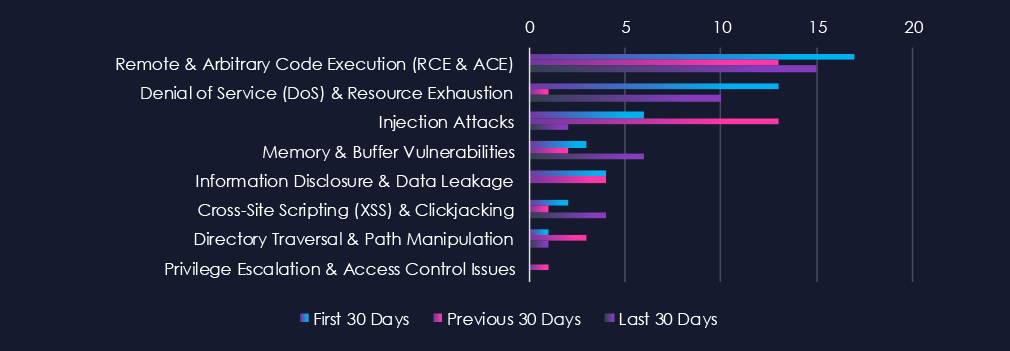
Remote & Arbitrary Code Execution (RCE & ACE) are leading the chart. Denial of Service (DoS) & Resource Exhaustion, despite a major dip in the previous 30 days, scored second. Inversely, the Injection Attack recorded a huge spike in the previous 30 days and placed third.

Below is a breakdown of reported CVEs in the last 90 days:
Remote & Arbitrary Code Execution (RCE & ACE)
17 → 13 → 15, Sustained at a high level across all periods. This reflects an ongoing discovery of critical flaws in operational technology (OT), industrial control systems (ICS), and energy management.
Denial of Service (DoS) & Resource Exhaustion
13 → 1 → 10, Sharp drop mid-period followed by a resurgence. The recent increase may coincide with vendor patch cycles or renewed focus on availability concerns in energy control networks after recent DDoS activity across the sector.
Injection Attacks
6 → 13 → 2, A temporary surge in the middle period but falling sharply thereafter, indicates that earlier research likely concentrated on web and API interfaces, with fewer recent disclosures in this category.
Memory & Buffer Vulnerabilities
3 → 2 → 6, Noticeable uptick in the latest period. This suggests a rise in findings tied to legacy embedded systems or OT devices that remain common in the energy infrastructure stack.
Information Disclosure & Data Leakage
4 → 4 → 0, Consistent early activity but none reported in the latest period, suggests that recent disclosure focus has shifted away from data exposure toward higher-severity issues such as RCE or DoS.
Cross-Site Scripting (XSS) & Clickjacking
2 → 1 → 4, Increase in the most recent period points to renewed attention to web-based management interfaces or monitoring dashboards, particularly those accessible in ICS environments.
Directory Traversal & Path Manipulation
1 → 3 → 1, Minor and fluctuating reporting activity — these remain sporadic disclosures, not indicative of a broader trend.
Privilege Escalation & Access Control Issues
0 → 1 → 0, Minimal reporting, suggesting limited recent focus on authentication and role mismanagement flaws within energy software ecosystems.
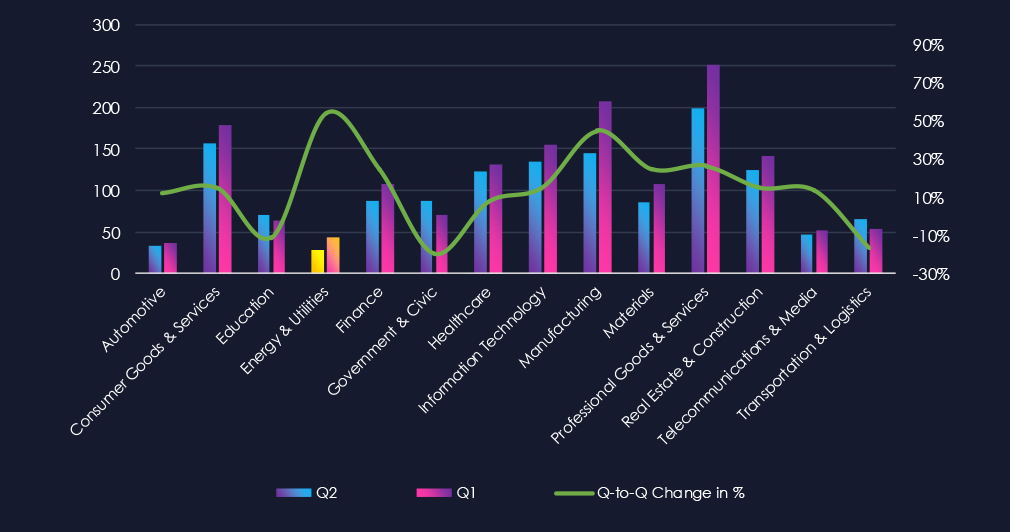
In the past 90 days, CYFIRMA has identified 43 verified ransomware victims in the energy & utilities industry. This accounts for 2.6% of the overall total of 1,639 ransomware victims during the same period, placing the energy & utilities industry 13th out of 14 industries.
Furthermore, a quarterly comparison reveals an increase of interest in energy & utilities organizations of 54% from 28 to 43 victims. The overall share of victims also grew from 1.9% to 2.6% of all victims.
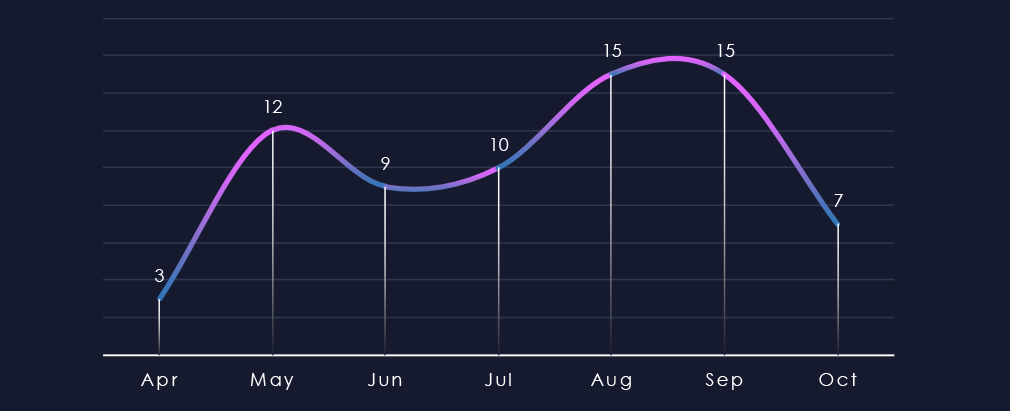
If we trim off partial months of April and October, we can clearly see the elevation in the last 90 days during August and September.
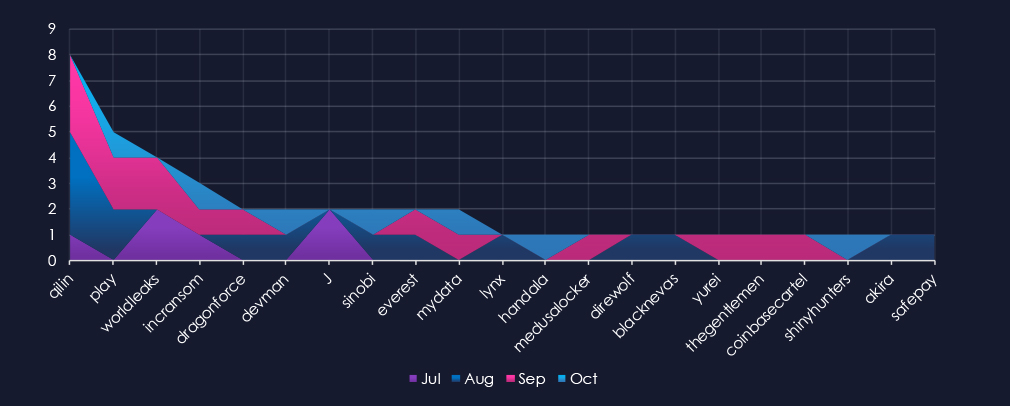
A breakdown of monthly activity per gang provides insights into which gangs were active each month. For example, the most active gang, Qilin, recorded the most victims in August, with a few more in September. J gang recorded victims only in July.
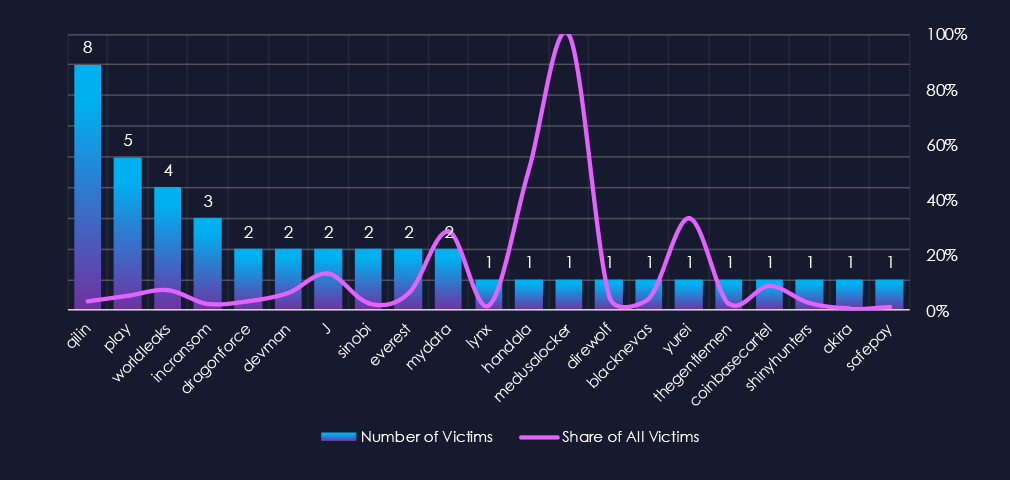
Out of the 75 gangs, 21 recorded victims in this industry in the last 90 days (28% participation). Qilin had the highest number of victims (8).
The share of victims for most gangs in this industry is low. Only 2 of the top 10 gangs recorded 10% or more of the victims in this industry, while 4 have below 5%.
Among the top 10 gangs, Worldleaks (7.3%), J (13.3%), and MyData (28.6%) recorded high shares in this industry, suggesting possible focus on energy & utilities organizations. Though the total number of victims is low, it is skewing the percentages.
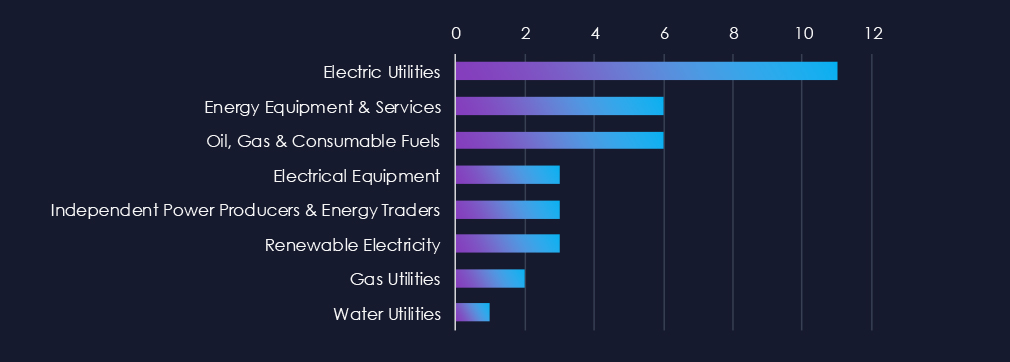
Electric utilities are the most frequent victims of ransomware in this industry. Energy equipment & services and Oil, Gas & Fuels follow in the second and third place.
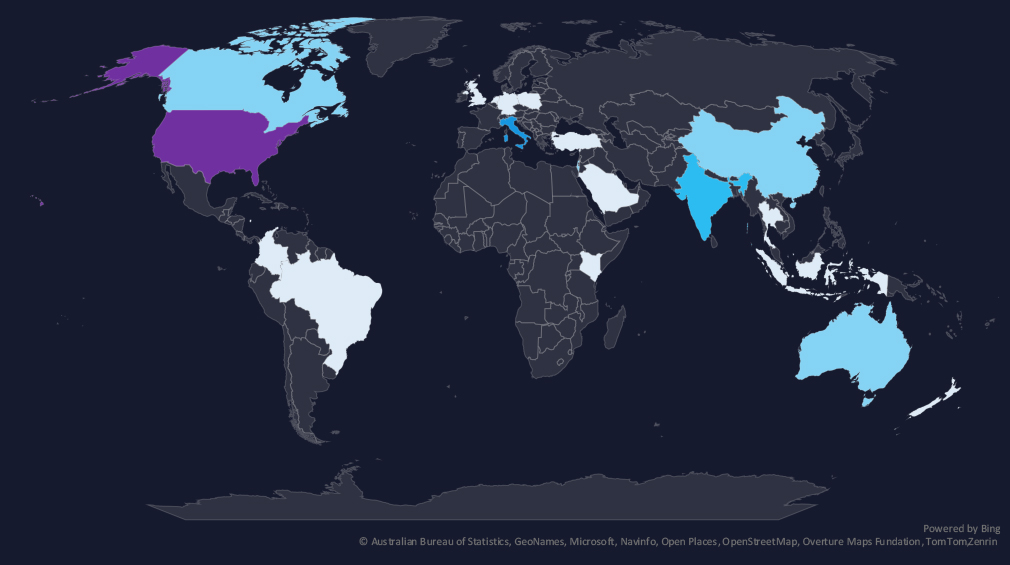
The geographic distribution heatmap underscores the widespread impact of ransomware, highlighting the countries where victims in this industry have been recorded.
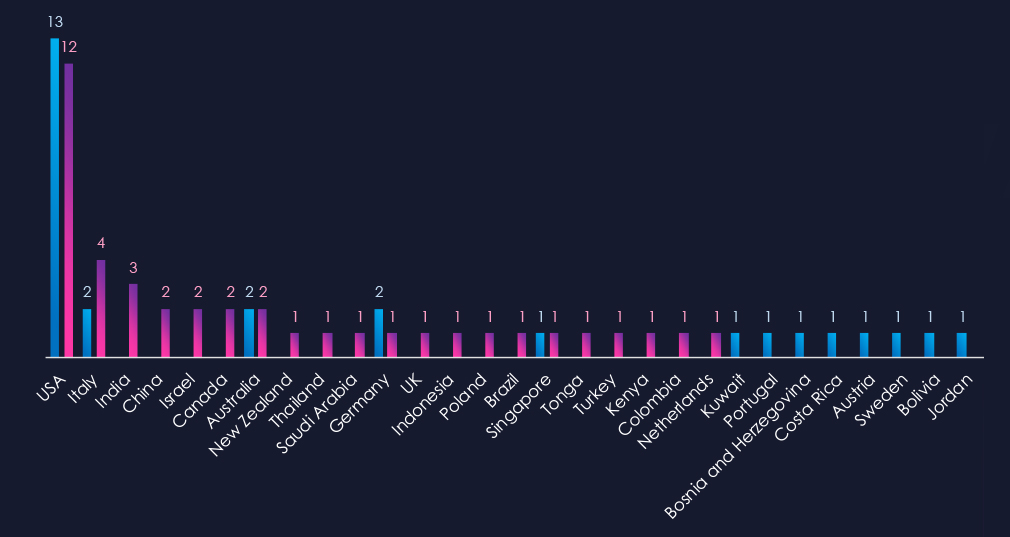
The chart shows quarter-to-quarter changes in targeted countries. Data is sorted by the last 90 days and compared to the previous 90 days, marked in blue.
The USA recorded 12 victims in the last 90 days, one less than in the previous period, and representing 29% of all victims. Italy and India follow in the top 3.

The energy & utilities industry placed 13th out of 14 monitored industries, recording 43 victims in the last 90 days, a major increase of +54% from 28 victims in the previous 90-day period.
Overall share grew from 1.9% to 2.6% of all ransomware victims.
Monthly Activity Trends
Monthly activity recorded a significant jump in elevation in August and September.
The energy & utilities industry is not a very frequent target of ransomware, most likely due to its largely operational technology use.
Ransomware Gangs
A total of 21 out of 75 active ransomware groups targeted this industry in the past 90 days – 28% participation:
Qilin: The most active, with 8 victims and just 3% (8 out of 233) share of victims.
Worldleaks, J, MyData: Highest shares of 7.4% (4 out of 55), 13.% (2 out of 15), and 28.6% (2 out of 7) victims among top gangs.
Geographic Distribution
The geographic distribution of ransomware victims is relatively low, but spread across the globe. The USA (12) accounted for 29% of all victims, followed by Italy (4) and India (3).
In total, 21 countries recorded ransomware victims in this industry in the last 90 days, one more than 20 in the previous period.
For a comprehensive, up-to-date global ransomware tracking report, please refer to our new monthly “Tracking Ransomware” series here.
APT Campaigns (Low): The energy & utilities sector experienced limited but notable APT activity over the last 90 days, with 3 of 22 observed campaigns (14%) affecting the industry, up slightly from two in the prior period. Attacks occurred sporadically in July and September, indicating irregular but ongoing interest. Threat actors included Turkish-speaking CCTR2501, Russia’s Turla and Fancy Bear, China’s APT27, and North Korea’s Lazarus Group. Affected regions spanned 17 countries, with a focus on Saudi Arabia, South Korea, Japan, Thailand, and India. Attack vectors were diverse, ranging from Android devices to RDP and storage management systems, showing both IT and OT targeting.
Underground & Dark Web Chatter (Low): Energy & utilities chatter showed consistent but moderate activity. Data breaches remained high (203 → 251 → 242), while data leaks followed a similar trajectory. Ransomware mentions declined after a mid-period spike, suggesting a tactical shift toward access sales and data theft. Web exploit chatter dropped sharply, implying reduced focus on direct web vectors. Claimed hacks rebounded slightly, while DDoS-related mentions rose notably in the latest period, reflecting renewed disruption efforts amid geopolitical tensions. Hacktivism persisted at low but steady levels, often tied to energy geopolitics or environmental protests.
Vulnerabilities (Low): The sector accounted for 4.18% of industry-linked vulnerabilities (ranked 9th). RCE and ACE vulnerabilities remained consistently high, underscoring systemic exposure in industrial control and energy management systems. DoS vulnerabilities dropped mid-period but rebounded as vendors released new patches tied to network availability. Injection flaws declined sharply, while memory and buffer vulnerabilities rose, reflecting scrutiny of legacy OT devices. Minor increases in XSS were observed in web-based dashboards and ICS monitoring tools, while privilege escalation and data disclosure flaws remained minimal.
Ransomware (Low): Ransomware activity increased 54%, with 43 victims (up from 28), though the industry remains a relatively infrequent target due to its heavy reliance on OT. Qilin was the most active group, responsible for 8 victims, followed by Worldleaks, J, and MyData, which each showed high proportional targeting within their operations. The USA accounted for 29% of incidents (12 victims), with Italy and India trailing behind. Overall, 21 countries recorded victims, one more than in the previous period, reflecting the globally distributed but limited nature of ransomware targeting in the energy sector.