

The CYFIRMA Industry Report delivers original cybersecurity insights and telemetry-driven statistics of global industries, covering one sector each week for a quarter. This report focuses on the professional goods & services industry, presenting key trends and statistics in an engaging infographic format.
Welcome to the CYFIRMA infographic industry report, where we delve into the external threat landscape of the professional goods & services industry over the past three months. This report provides valuable insights and data-driven statistics, delivering a concise analysis of attack campaigns, phishing telemetry, and ransomware incidents targeting the professional goods & services sectors.
We aim to present an industry-specific overview in a convenient, engaging, and informative format. Leveraging our cutting-edge platform telemetry and the expertise of our analysts, we bring you actionable intelligence to stay ahead in the cybersecurity landscape.
CYFIRMA provides cyber threat intelligence and external threat landscape management platforms, DeCYFIR and DeTCT, which utilize artificial intelligence and machine learning to ingest and process relevant data, complemented by manual CTI research.
For the purpose of these reports, we leverage the following data from our platform. These are data processed by AI and ML automation based on both human research input and automated ingestions.
While this report contains statistics and graphs generated primarily by automation, it undergoes a thorough review and enhancement for additional context by CYFIRMA CTI analysts to ensure the highest quality and provide valuable insights.
Over the past 90 days, the professional goods & services industry featured in 11 out of the 14 observed campaigns, which is a presence in 76% of all campaigns. That is an increase from 7 in the previous 90 days, and a minor increase in overall share from 70% (7 out of 10).
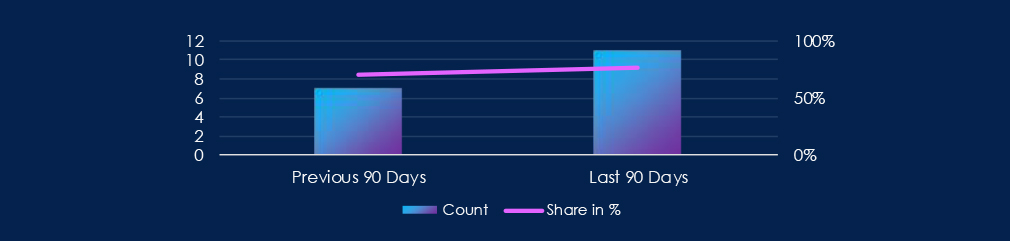

Activity peaked during June and July. August did not record new campaigns, but it is likely that June and July campaigns are ongoing.
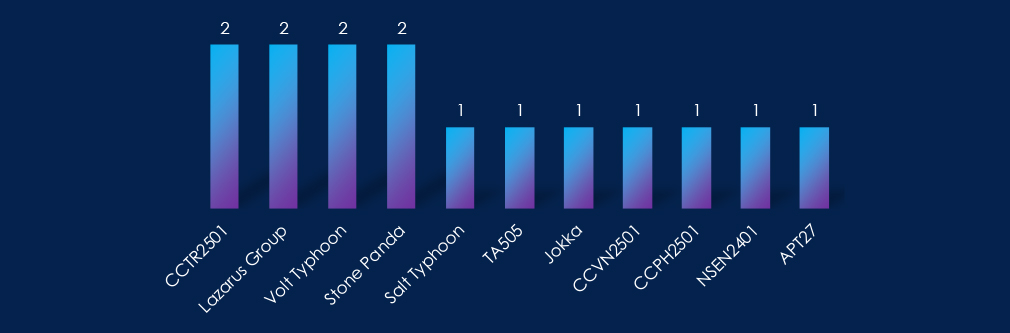
Active threat actors originate from various regions worldwide. Examples include Chinese Volt, Salt Typhoon, Stone Panda, and APT27; Russian TA505; Turkish, Vietnamese, and Philippine cybercriminals; and North Korean Lazarus Group.
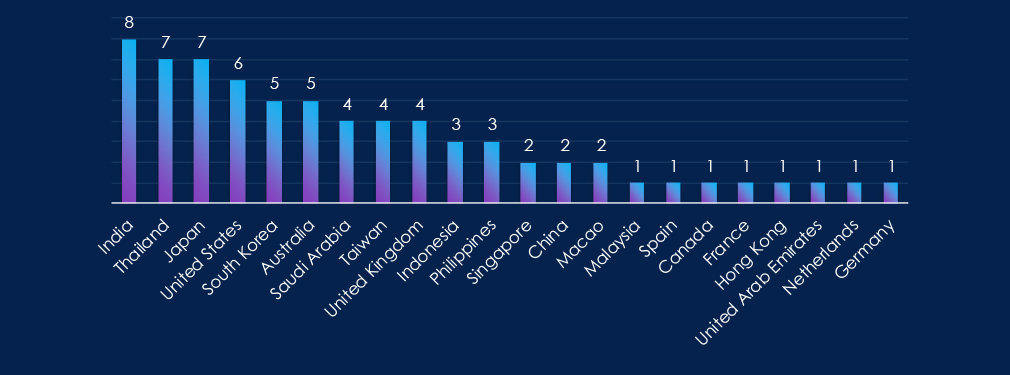
India is leading the chart with a presence in 8 out of 11 observed campaigns. In second place are Thailand and Japan. The USA ranked in third place.
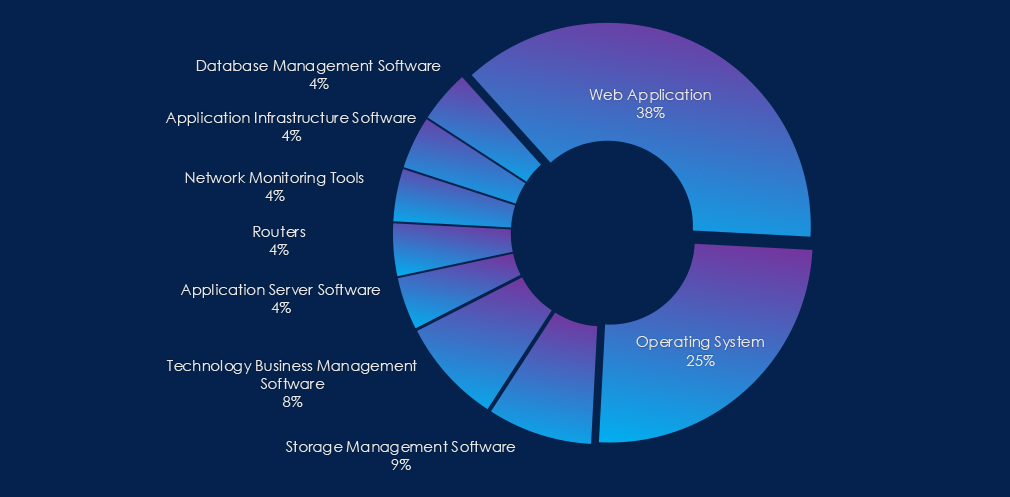
Web applications are the most common primary attack vector, followed by operating system vulnerabilities. Additionally, various network, management, database, and infrastructure software were observed as exploited attack vectors.

Over the past 90 days, the professional goods & services industry has been significantly affected by advanced persistent threat (APT) campaigns.
Out of the 14 observed APT campaigns, 11 targeted this sector, representing 76% of the observed campaigns. This is an increase from the previous 90-day period, during which 7 out of 10 campaigns targeted professional goods & services businesses.
Monthly Trends
June and July recorded 6 and 5 campaigns, respectively. August did not observe a new campaign, but many campaigns do continue.
Key Threat Actors
Active threat actors originate from various regions worldwide. Examples include Chinese Typhoons APT27 or Stone Panda, Russian TA505, Turkish, Philippine, Vietnamese cybercriminals, English-speaking threat actors, and North Korean Lazarus Group.
Geographical Impact
Overall, 23 countries recorded victims in the observed campaigns.
Thailand and India lead the chart with their presence in 8 out of 11 observed campaigns.
Japan is in second place, while South Korea and the USA share third place.
Targeted Technologies
Most campaigns employed Web Applications as their primary attack vectors. Many campaigns also exploited operating system vulnerabilities. Furthermore, various network, management, database, and infrastructure software were observed.
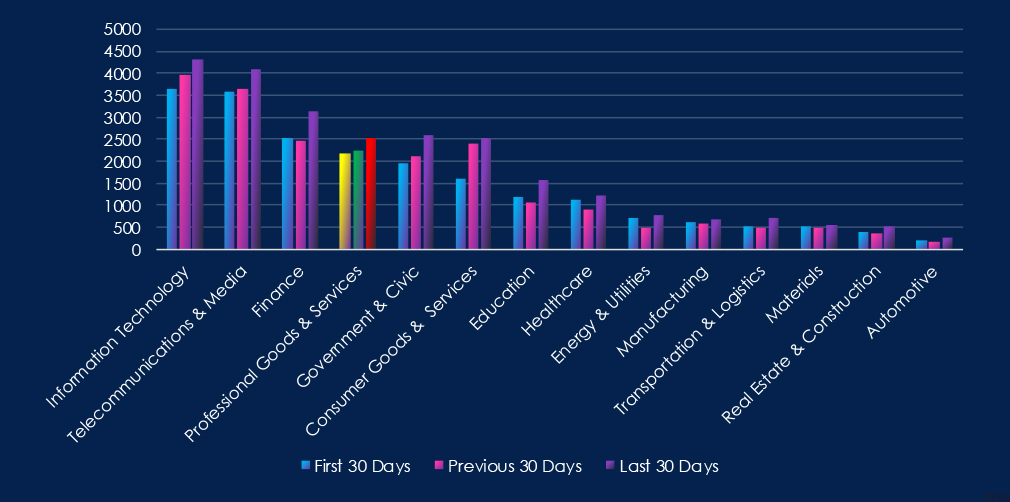
Over the past three months, CYFIRMA’s telemetry has identified 6,963 mentions of the professional goods & services industry out of a total of 67,584 industry mentions. This is from a total of 300k+ posts across various underground and dark web channels and forums.
The professional goods & services industry placed 4th out of 14 industries in the last 90 days, with a share of 10.3% of all detected industry-linked chatter.
Below is a breakdown by 30-day periods of all mentions.
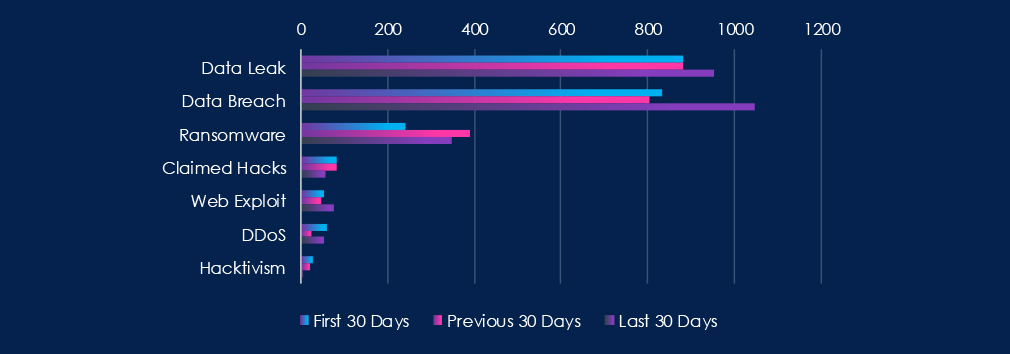
Data Leaks and Data Breaches are by far the most common category of recorded chatter, spiking during the last 30 days and showing high sustained interest. Ransomware chatter has steadily grown over the last 90 days.

In total, the professional goods & services industry comprises 10.3% of all detected industry underground and dark web chatter in the last 90 days. And ranking 4th out of 14 industries.
Below are observed key trends across 90 days:
Data Breach
882 → 883 → 952, Stable at first, then rising in the latest 30 days. Indicates consistent exposure of sensitive business data.
Data Leak
833 → 805 → 1048, Significant increase in the most recent period. Suggests a wave of successful compromises of professional service firms, which often hold high-value client data and intellectual property.
Ransomware
240 → 391 → 347, Spiked in the middle period before a slight decline, but still elevated. Ransomware groups continue to aggressively target professional services.
Claimed Hacks
82 → 81 → 57, Gradual decline across the periods. It could reflect fewer public brag posts, with attackers moving toward quieter monetization through direct extortion or data resale.
Web Exploit
53 → 46 → 77, Sharp increase in the latest period, highlighting ongoing exploitation of client portals, collaboration tools, and industry-specific web apps as attack vectors.
DDoS
58 → 25 → 54, Dropped sharply, then rebounded in the last 30 days. Suggests episodic disruption campaigns, possibly tied to extortion or specific high-profile targets.
Hacktivism
26 → 21 → 2, Rapid decline to negligible levels. Indicates ideological targeting of the sector has largely faded, leaving financially motivated activity as the dominant threat.
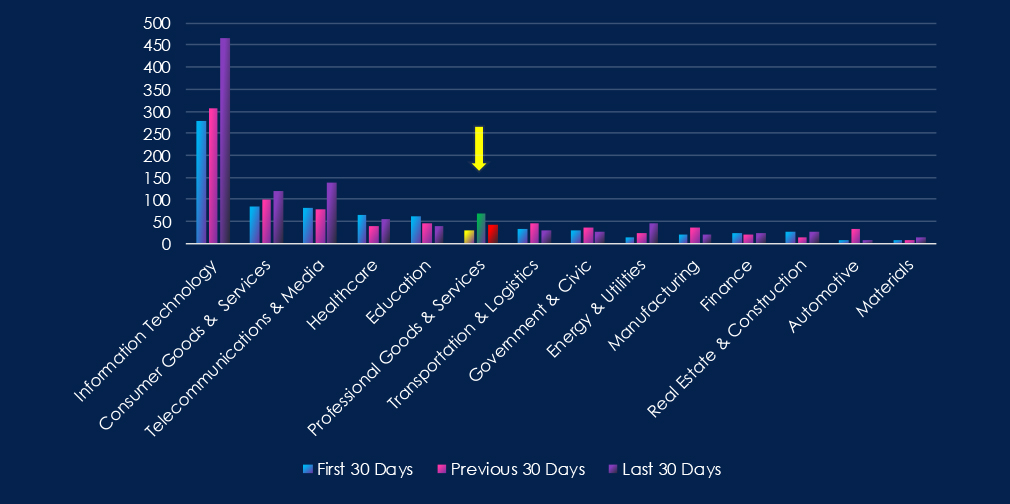
Over the past three months, CYFIRMA’s telemetry has identified 140 mentions of the professional goods & services industry out of a total of 2,652 industry mentions. This is from over 10k CVEs reported and updated in the last 90 days.
The professional goods & services industry ranked 6th out of 14 industries in the last 90 days, with a share of 5.3% of all detected industry-linked vulnerabilities.
Below is a breakdown by 30-day periods of all mentions.
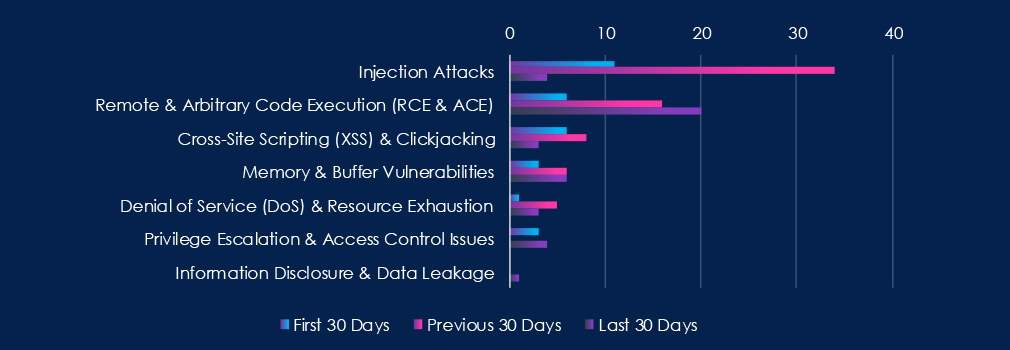
Injection Attack after huge spike in previous 30 days period and Remote & Arbitrary Code Execution (RCE & ACE) are leading the chart.

In total, the professional goods & services industry comprises 5.3% of all detected industry-linked vulnerabilities in the last 90 days. And ranking 6th out of 14 industries.
Below are observed key trends across 90 days.
Injection Attacks
11 → 34 → 4, Large spike in the middle period, then a sharp drop in the latest 30 days. This suggests a concentrated wave of testing or disclosures earlier on, with fewer injection flaws recently being reported.
Remote & Arbitrary Code Execution (RCE & ACE)
6 → 16 → 20, Steady rise across all periods. Reflects growing identification of high-impact vulnerabilities in this sector’s commonly used software stacks, especially those with client-facing functionality.
Cross-Site Scripting (XSS) & Clickjacking
6 → 8 → 3, Declining in the latest period after small increases earlier. Indicates fewer client-side vulnerabilities being disclosed, potentially due to better secure coding practices or patch cycles.
Memory & Buffer Vulnerabilities
3 → 6 → 6, Gradual increase and then levelling off. Suggests researchers are still finding memory-handling flaws, often linked to third-party libraries or legacy components.
Denial of Service (DoS) & Resource Exhaustion
1 → 5 → 3, Moderate disclosure levels, reflecting some attention on service availability flaws, but not a dominant category.
Privilege Escalation & Access Control Issues
3 → 0 → 4, Resurfaced in the latest period after a lull. Indicates periodic discovery of role or permission weaknesses, often uncovered during deeper security reviews.
Information Disclosure & Data Leakage
0 → 0 → 1, Minimal disclosure activity, but the isolated recent case highlights that information exposure remains a background risk.
In the past 90 days, CYFIRMA has identified 224 verified ransomware victims in the professional goods & services industry. This accounts for 15.1% of the overall total of 1,483 ransomware victims during the same period. Placing the professional goods & services sectors 1st out of 14 industries.
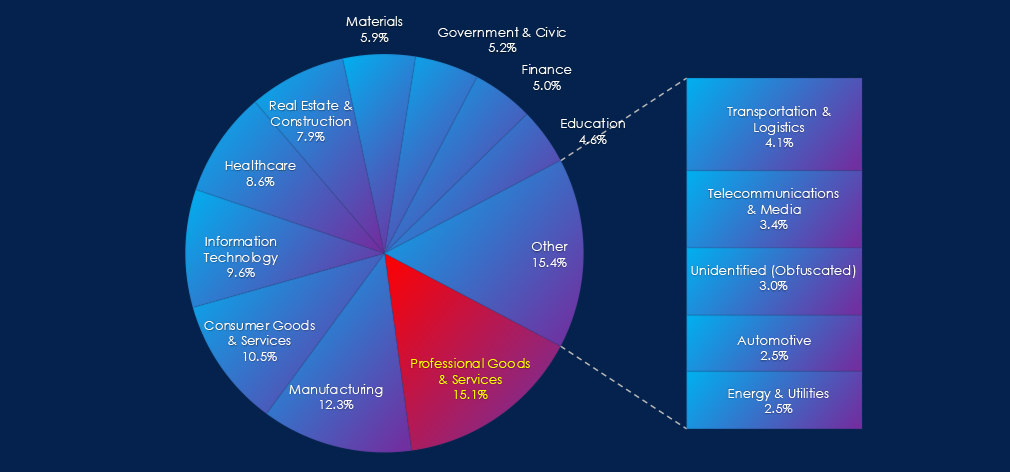
Furthermore, a quarterly comparison reveals a mild increase in victims in the professional goods & services industry by 3.2% from 217 to 224 victims. The overall share of victims also increased from 13.2% to 15.1% of all victims.
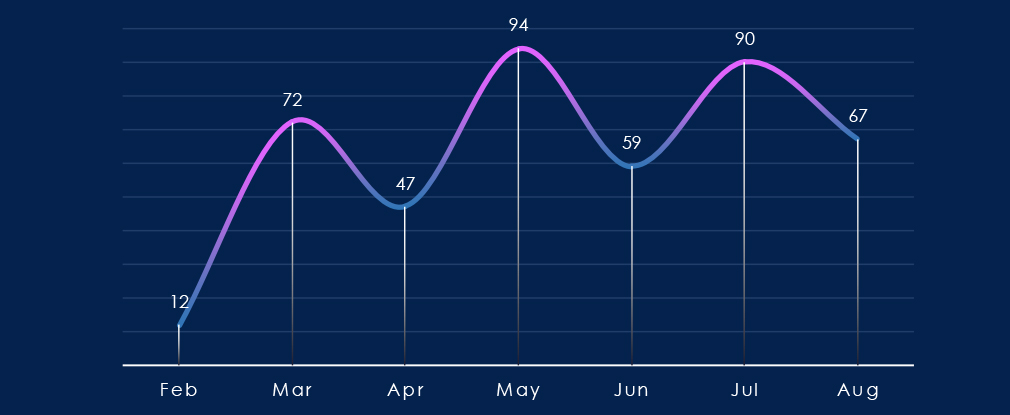
Over the past 180 days, the number of victims has been sustained but somewhat choppy, with high activity months alternating with more moderate months.
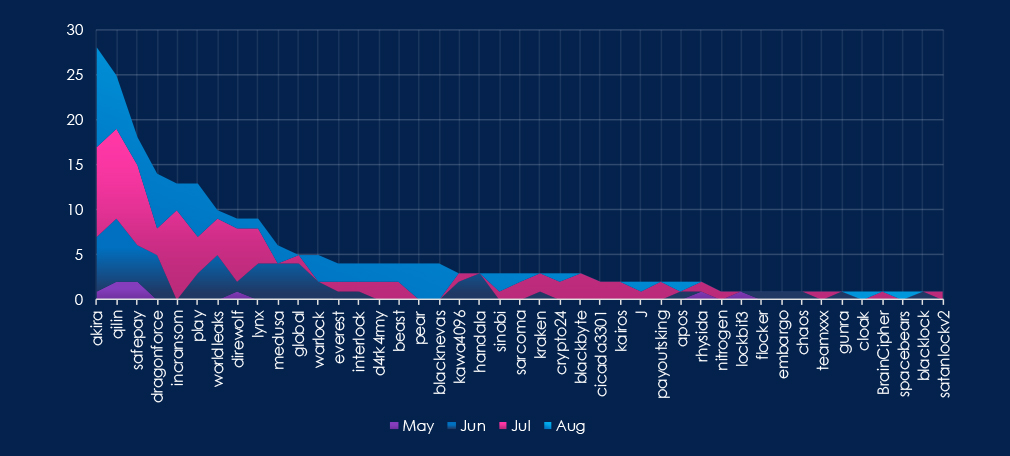
A breakdown of monthly activity per gang provides insights into which gangs were active each month. For example, by far the most active gang was Akira, active across the last 3 months. On the other hand, the fifth most active gang, Incransom, recorded the most victims in July and a few in August.
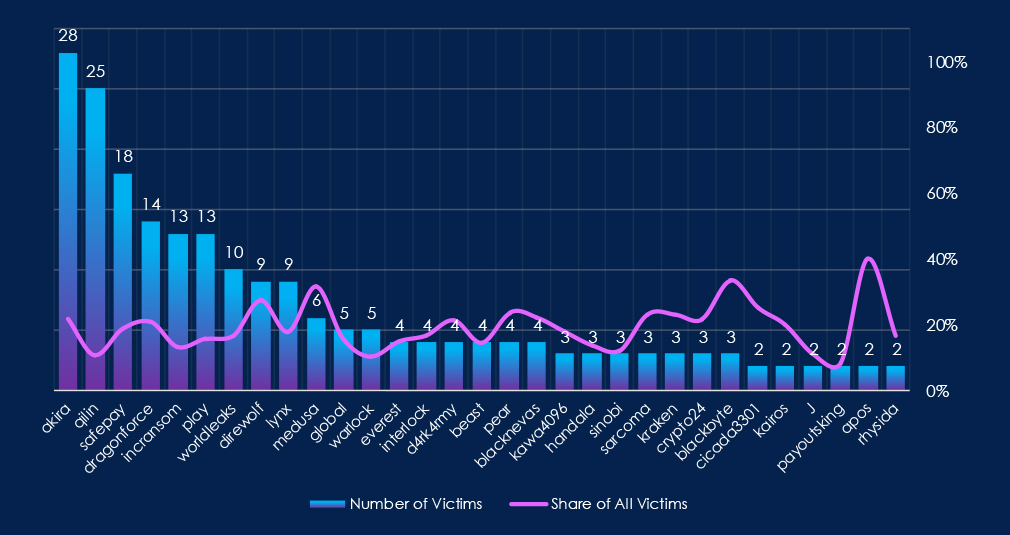
Out of the 72 gangs, 43 recorded victims in this industry in the last 90 days (60% participation). Akira had the highest number of victims (28) with a high share (22%).
The share of victims for many gangs in this industry is very high. Many gangs have more than 20% or 30% share of their victims from small and medium businesses.
Medusa (32%), Direwolf (27%), and Dragonforce (21%) had the highest shares of victims among more active gangs, implying a high focus on this industry.
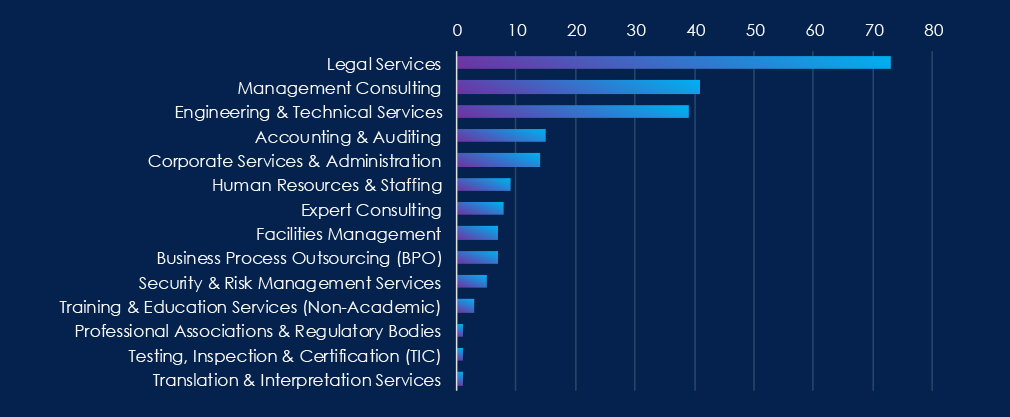
Legal Services are the most frequent victims of ransomware in this industry. At some distance are Management Consulting and Engineering & Technical Services.
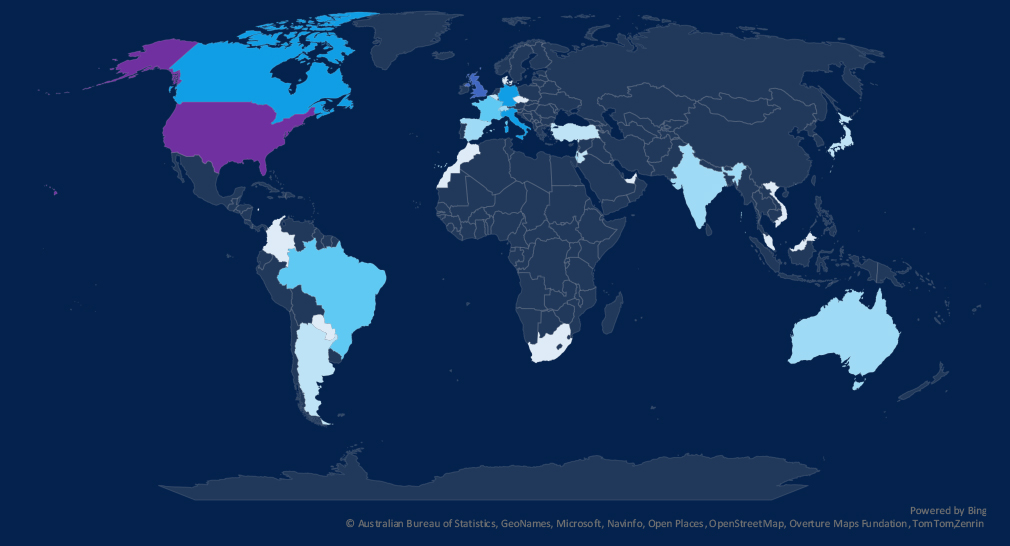
The geographic distribution heatmap underscores the widespread impact of ransomware, highlighting the countries where victims in this industry have been recorded in the last 90 days.
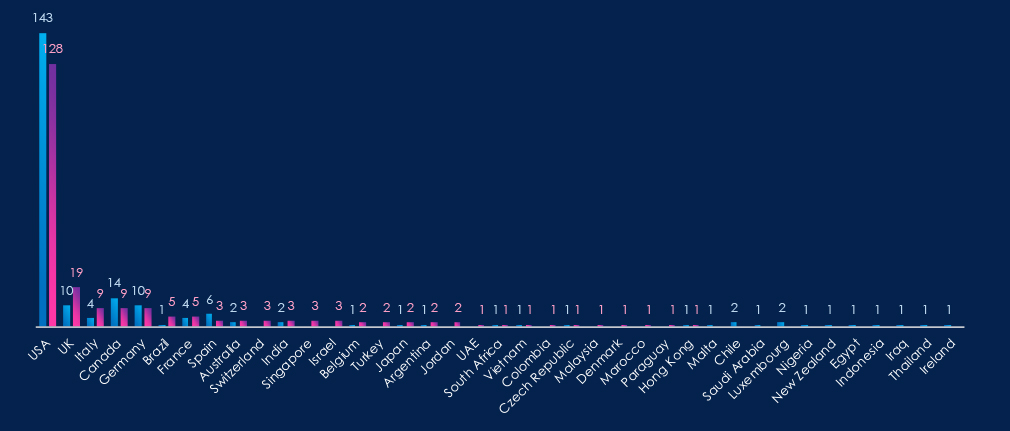
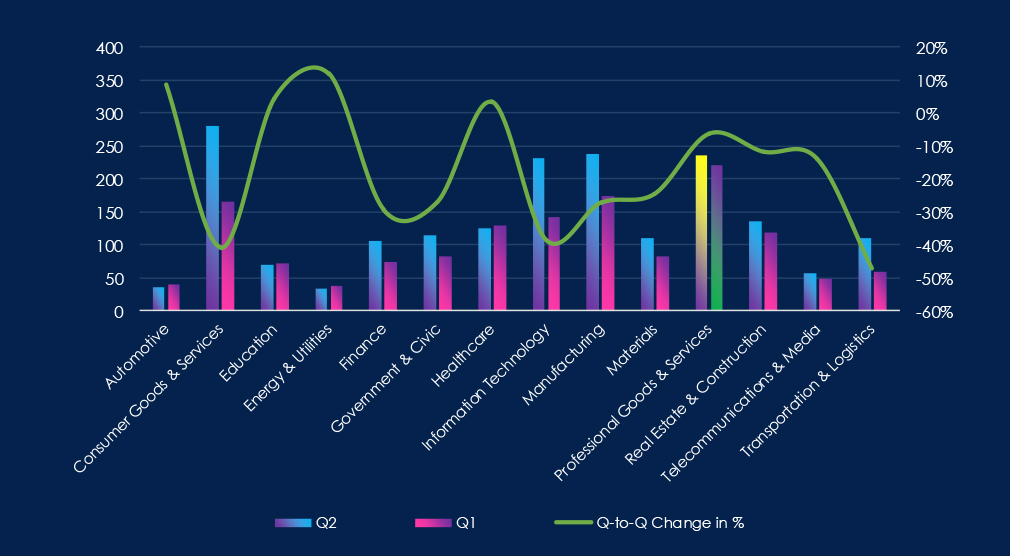
The chart shows quarter-to-quarter changes in targeted countries. Data is sorted by the last 90 days and compared to the previous 90 days, marked in blue.
In the last 90 days, the USA recorded 128 victims (57% of all victims). The UK was second with 19, and Italy, Canada, and Germany follow in shared 3rd place. Canada and the USA recorded a drop in victims, while the UK, Switzerland, and Singapore recorded increases.
Many countries from the previous 90 days did not record new victims at all.

The professional goods & services are the most frequent victims of ransomware. This is largely due to the high number of small and medium-sized businesses present. *High risk factor exists especially for legal services.
The number of victims remained steady and mildly increased since the previous 90-day period (217 to 224). Overall share also rose from 13.2%% to 15.1% of all ransomware victims
Monthly Activity Trends
Victim numbers have held at a consistent level but with noticeable swings, as months of elevated activity alternated with more moderate ones.
Ransomware Gangs
A total of 43 out of 72 active ransomware groups targeted this industry in the past 90 days, representing 60% participation:
Akira: The most active, with 28 victims, has a high share of 22% (28 out of 129) of all their victims.
Qilin: Second most active with 10.7% (25 out of 234) share.
Medusa, Direwolf, and Dragonforce: Highest shares of 32% (6 out of 19), 27% (9 out of 33), and 21% (14 out of 68) victims among top gangs, showing a high focus on this industry.
Geographic Distribution
The geographic distribution of ransomware victims is relatively high yet quite concentrated in the USA*(USA warrants a higher risk), which accounts for 57% of all victims.
With 19 cases, the UK held second place; Italy, Canada, and Germany followed jointly in third. Canada and the USA saw fewer victims, whereas the UK, Switzerland, and Singapore registered increases.
In total, 28 countries recorded ransomware victims in this industry in the last 90 days, curiously exactly the same as in the previous period.
For a comprehensive, up-to-date global ransomware tracking report, please refer to our new monthly “Tracking Ransomware” series here.
APT Campaigns (High): The professional goods & services sector faced heavy APT targeting, with 11 of 14 observed campaigns (76%) involving this industry—up from 70% since the last period. Campaigns peaked in June (6) and July (5). Threat actors included Chinese groups, such as APT27 and Stone Panda, Russian TA505, North Korea’s Lazarus Group, and actors from Turkey, Vietnam, the Philippines, and English-speaking regions. Victims were reported in 23 countries, with Thailand and India appearing in 8 campaigns each, followed by Japan, South Korea, and the USA. Attack vectors centered on web applications, operating systems, and industry-specific management and database software.
Underground & Dark Web Chatter (High): The industry accounted for 10.3% of all dark web chatter, ranking 4th. Data breaches remained consistently high and rose in the latest period (952). Data leaks surged to 1,048, underscoring the growing compromise of client data and IP. Ransomware chatter spiked mid-period and remained elevated. Claimed hacks declined, suggesting quieter monetization via extortion or resale. Web exploit mentions jumped to 77, highlighting the exploitation of portals and collaboration tools. DDoS activity fluctuated, rebounding sharply in the last 30 days, while hacktivism dropped to negligible levels.
Vulnerabilities (Moderate): This sector accounted for 5.3% of disclosed vulnerabilities, ranking 6th. Injection attacks spiked in the middle period but dropped sharply. Remote Code Execution (RCE) rose steadily, reaching 20 disclosures, underscoring its critical risk. XSS dropped to 3, suggesting fewer client-side flaws are being reported. Memory vulnerabilities are rated at 6, reflecting persistent risks in third-party or legacy software. DoS disclosures were moderate (3). Privilege escalation reappeared after a lull, while information disclosure was minimal, with only 1 case.
Ransomware (High): Professional goods & services remain prime ransomware targets, particularly SMEs and legal firms. Victims increased slightly from 217 to 224, raising the sector’s share of global ransomware from 13.2% to 15.1%. Akira was the most aggressive, recording 28 victims (22% of its total). Qilin followed with 25, while Medusa, Direwolf, and Dragonforce showed disproportionate concentration on this sector, with up to one-third of their victims here. The USA dominated with 57% of victims, followed by the UK (19 cases), Italy, Canada, and Germany. Notably, the UK, Switzerland, and Singapore saw increases, while Canada and the USA recorded fewer cases. Victims were spread across 28 countries—unchanged from the previous period.