

The CYFIRMA Industry Report delivers original cybersecurity insights and telemetry-driven statistics of global industries, covering one sector each week for a quarter. This report focuses on the manufacturing industry, presenting key trends and statistics in an engaging infographic format.
Welcome to the CYFIRMA infographic industry report, where we delve into the external threat landscape of the manufacturing industry over the past three months. This report provides valuable insights and data-driven statistics, delivering a concise analysis of attack campaigns, phishing telemetry, and ransomware incidents targeting manufacturing organizations.
We aim to present an industry-specific overview in a convenient, engaging, and informative format. Leveraging our cutting-edge platform telemetry and the expertise of our analysts, we bring you actionable intelligence to stay ahead in the cybersecurity landscape.
CYFIRMA provides cyber threat intelligence and external threat landscape management platforms, DeCYFIR and DeTCT, which utilize artificial intelligence and machine learning to ingest and process relevant data, complemented by manual CTI research.
For the purpose of these reports, we leverage the following data from our platform. These are data processed by AI and ML automation based on both human research input and automated ingestions.
While this report contains statistics and graphs generated primarily by automation, it undergoes a thorough review and enhancement for additional context by CYFIRMA CTI analysts to ensure the highest quality and provide valuable insights.
Over the past 90 days, the Manufacturing Industry featured in 1 out of the 10 observed campaigns, which is a presence in 10% of all campaigns. That is a drop from 4 in the previous 90 days, and also a decline in the overall share from 66% (4 out of 6).
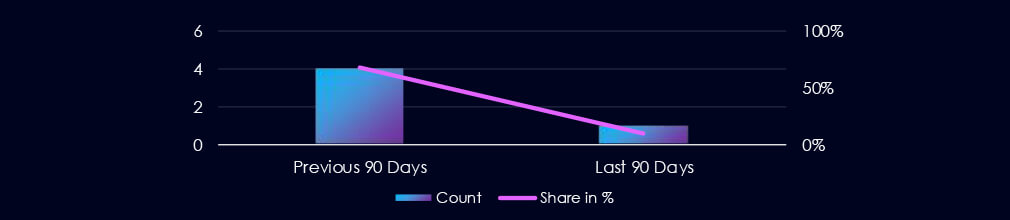

The last observed campaign was active during June.

The observed campaign showed overlapping TTPs between the Chinese nation-state-sponsored APT27 and the North Korean Lazarus Group.
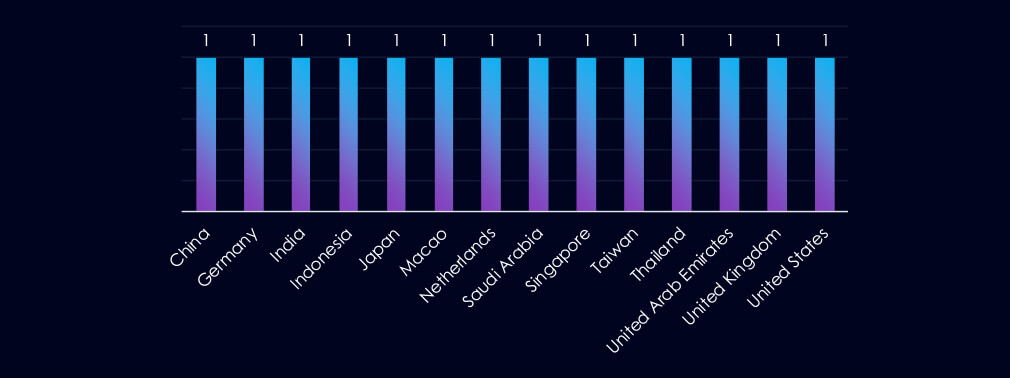
Countries with victims in the observed campaign are a mixed bag from Asia, Europe, the Middle East, and the USA. Also, given the suspected TA, we see China and Macao.

The observed campaign primarily targeted web applications as its primary attack vector.

Over the past 90 days, the manufacturing industry has not been significantly affected by advanced persistent threat (APT) campaigns.
Out of the 10 observed APT campaigns, only 1 targeted this industry, representing 10% of the observed campaigns. This is a decline from the previous 90-day period, during which 4 out of 6 campaigns targeted this industry.
Monthly Trends
The observed campaign was active during June.
Key Threat Actors
The campaigns showed overlapping TTPs between the Chinese nation-state APT27 and the North Korean Lazarus Group.
Geographical Impact
Countries with recorded victims are quite varied, from Asia, Europe, the Middle East, and also the USA. Confusingly, China and Macau are also included. But it wouldn’t be the first time a nation-state group was interested in domestic targets.
Targeted Technologies
The campaign focused primarily on web applications.
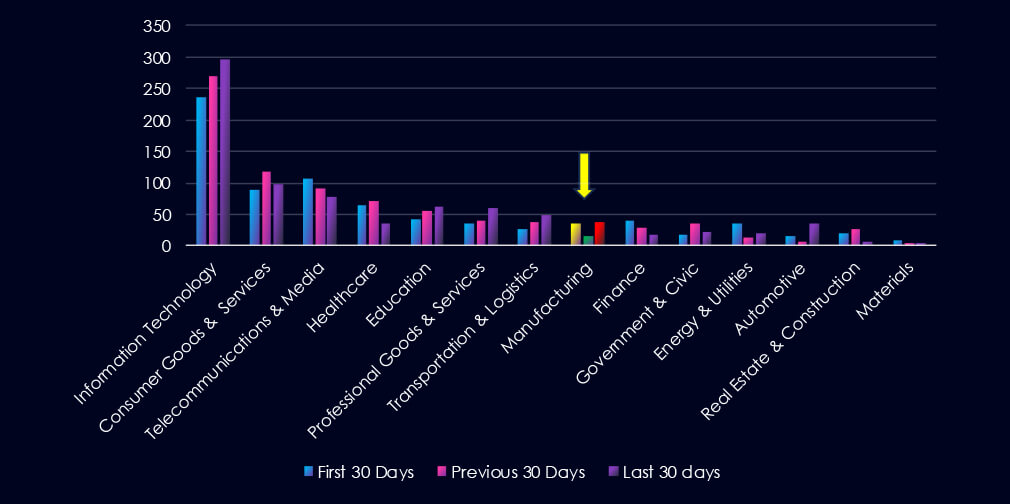
Over the past three months, CYFIRMA’s telemetry has identified 1,700 mentions of the manufacturing industry out of a total of 57,443 industry mentions. This is from a total of 300k+ posts across various underground and dark web channels and forums.
The Manufacturing Industry placed 10th out of 14 industries in the last 90 days with a share of 2.96% of all detected industry-linked chatter.
Below is a breakdown by 30-day periods of all mentions.
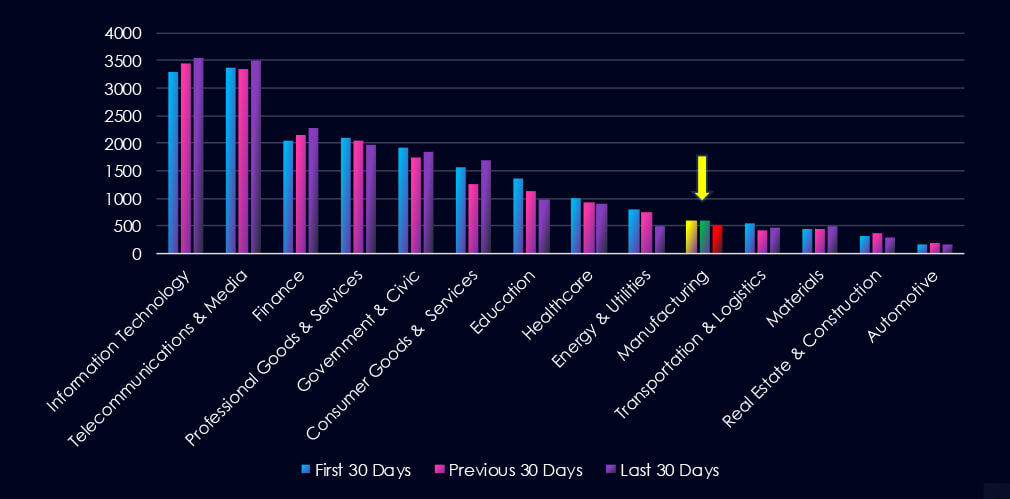
Data Leaks and Data Breaches are the most common category of recorded chatter for this industry. Both categories recorded a mild spike in the previous 30 days. Ransomware chatter surged in the first 30 days and then declined in the past 60 days.

In total, the manufacturing industry comprises 2.96% of all detected industry underground and dark web chatter in the last 90 days, ranking 10th out of 14 industries.
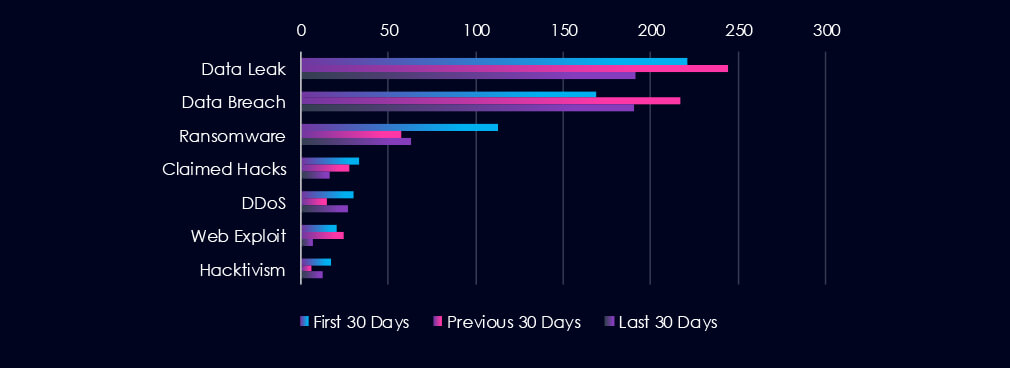
Below are observed key trends across 90 days:
Data Leak
221 → 244 → 191
Data leak mentions peaked last month. Still elevated, indicating ongoing exfiltration and exposure of sensitive manufacturing-related data.
Data Breach
169 → 217 → 190
Followed a similar pattern to data leaks—significant activity.
Ransomware
113 → 57 → 63
After a drop, ransomware mentions are climbing again slightly. Indicates ongoing interest from ransomware operators.
Claimed Hacks
33 → 28 → 16
Consistent decline, possibly suggesting fewer successful intrusions.
DDoS (Distributed Denial of Service)
30 → 15 → 27
A resurgence in mentions after a dip, possibly tied to hacktivism..
Web Exploit
20 → 24 → 7
A steep drop in mentions suggests patched or no new vulnerabilities.
Hacktivism
17 → 6 → 12
A renewed uptick, potentially linked to geopolitical events.
Over the past three months, CYFIRMA’s telemetry has identified 88 mentions of the manufacturing industry out of a total of 2,413 industry mentions. This is from over 10k CVEs reported and updated in the last 90 days.
The Manufacturing Industry ranked 8th out of 14 industries in the last 90 days, with a share of 3.65% of all detected industry-linked vulnerabilities.
Below is a breakdown by 30-day periods of all mentions.
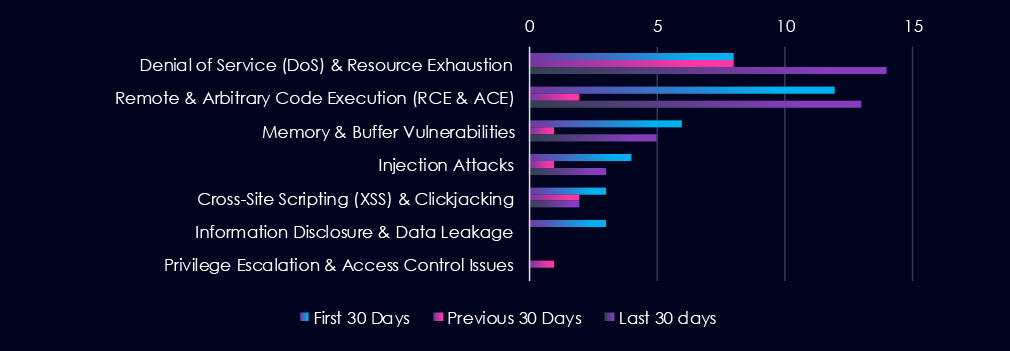
Denial of Service (DoS) & Resource Exhaustion vulnerabilities are leading the chart, as they recorded a spike during the last 30 days. Remote & Arbitrary Code Execution (RCE & ACE) vulnerabilities are second, with a dip in the previous 30 days.

In total, the manufacturing industry comprises 1.08% of all detected industry-linked vulnerabilities in the last 90 days, ranking 13th out of 14 industries.
Below are the observed key trends across 90 days.
Denial of Service (DoS) & Resource Exhaustion
8 → 8 → 14, Consistently present and now rising. Indicates increased discovery (or targeting) of flaws that could disrupt industrial systems or services—important for OT (Operational Technology) environments.
Remote & Arbitrary Code Execution (RCE & ACE)
12 → 2 → 13, After a sharp dip, RCEs have rebounded significantly. These are high-impact vulnerabilities, especially if they affect industrial control systems (ICS) or IoT-connected machinery.
Memory & Buffer Vulnerabilities
6 → 1 → 5, Minor resurgence. These can be exploited for DoS or RCE, and are common in embedded systems or older software used in manufacturing.
Injection Attacks
4 → 1 → 3, Activity remains low but present. Indicates exposure in web interfaces or production apps—a sign to harden input handling in MES or ERP systems.
Cross-Site Scripting (XSS) & Clickjacking
3 → 2 → 2, Steady, low-level threat—reflects exploitable weaknesses in internal portals or supplier/vendor platforms.
Information Disclosure & Data Leakage
3 → 0 → 0, No recent vulnerabilities reported in this category. But given high chatter around data breaches/leaks, zero-day or unreported vectors may still exist.
Privilege Escalation & Access Control Issues
0 → 1 → 0, Minimal exposure—potentially indicating patching or maturity, but still a critical area to monitor in case of lateral movement post-compromise.
In the past 90 days, CYFIRMA has identified 138 verified ransomware victims in the manufacturing industry. This accounts for 10.3% of the overall total of 1,346 ransomware victims during the same period, placing the manufacturing industry 3rd out of 14 industries.
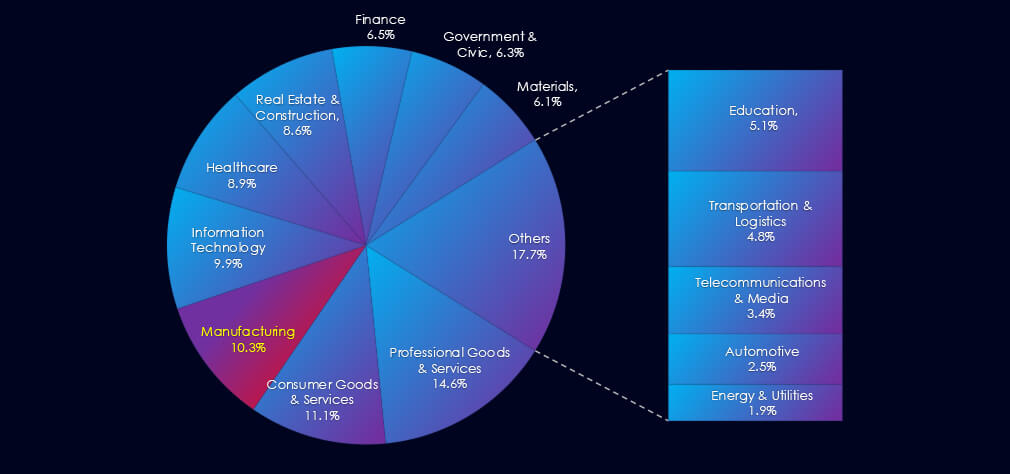
Furthermore, a quarterly comparison reveals a substantial drop in victims in the manufacturing industry, with a reduction of -50.7% from 280 to 138 victims. While the overall share of victims also decreased, the drop was more modest, falling from 12.55% to 9.95% of all victims.
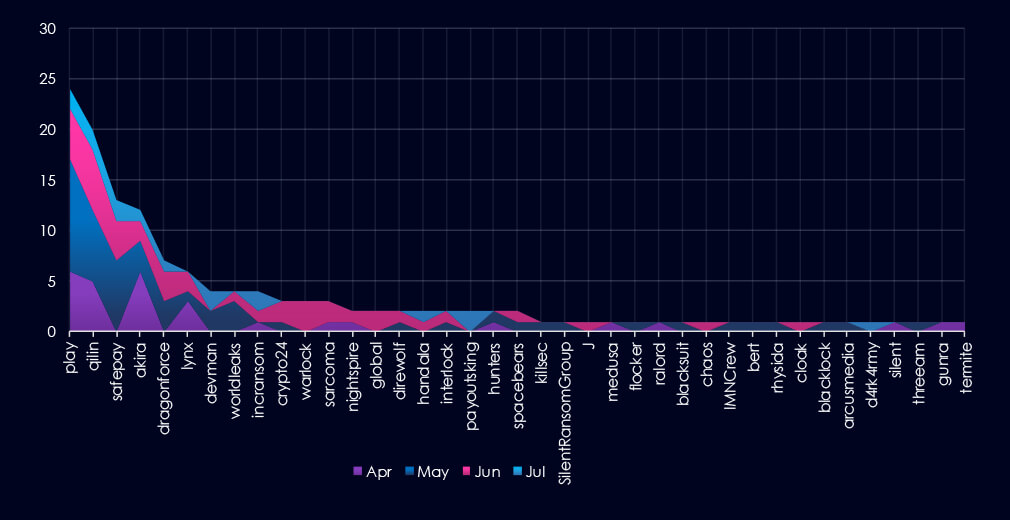
A breakdown of monthly activity per gang provides insights into which gangs were active each month. For example, by far the most active gangs, Play and Qilin, were highly active across all months. On the other hand, gangs like Warlock or Global were active only in June.
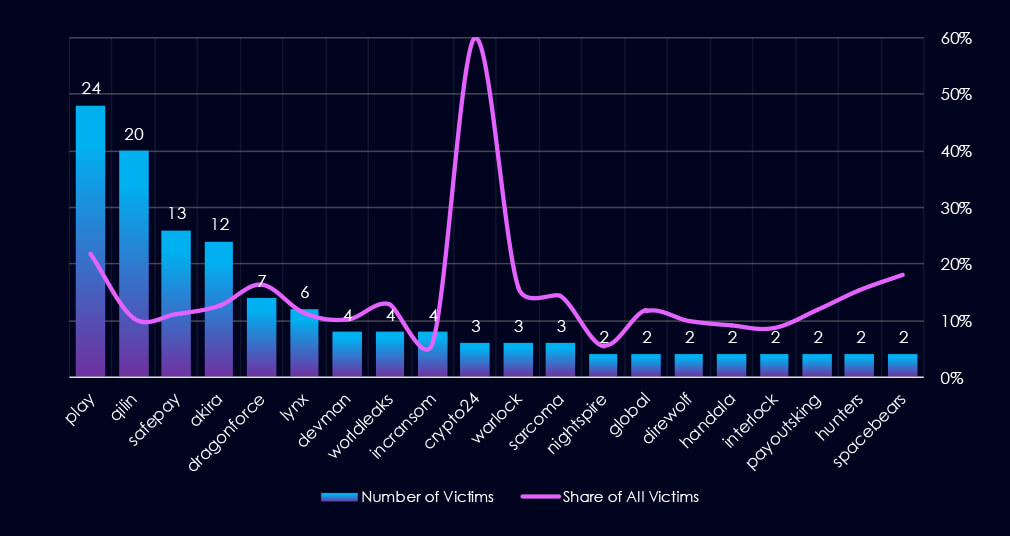
The chart above shows only the top victims with more than one victim. Out of the 72 gangs, 39 recorded victims in this industry in the last 90 days (54% participation). Play had the highest number of victims (24).
The share of victims for most gangs in this industry is high. From the top 10, only one gang recorded a share below 10% – IncRansom(6.2%).
Among the top gangs, Play (21.8%), Dragonforce (16.3%), and Crypto24 (60%) had the highest share of victims, implying a high focus on this industry.
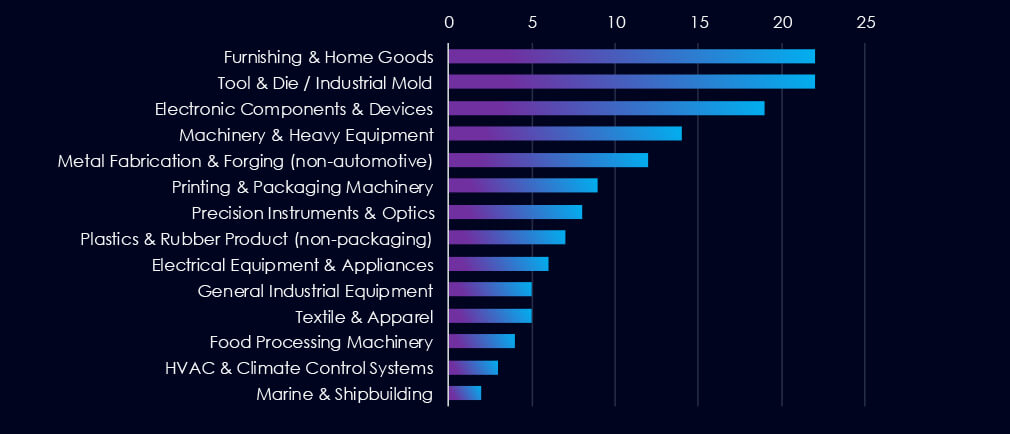
Furnishing & Home Goods manufacturing, Tool & Die / Industrials Molds, and Electronic Components & Devices manufacturing are the most frequent victims of ransomware in this industry.
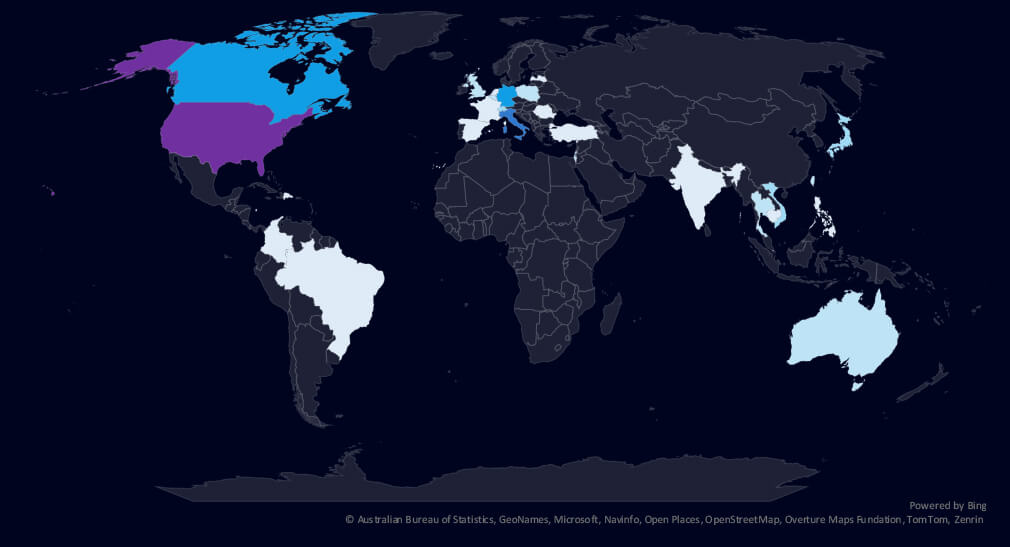
The geographic distribution heatmap underscores the widespread impact of ransomware, highlighting the countries where victims in this industry have been recorded in the last 90 days.
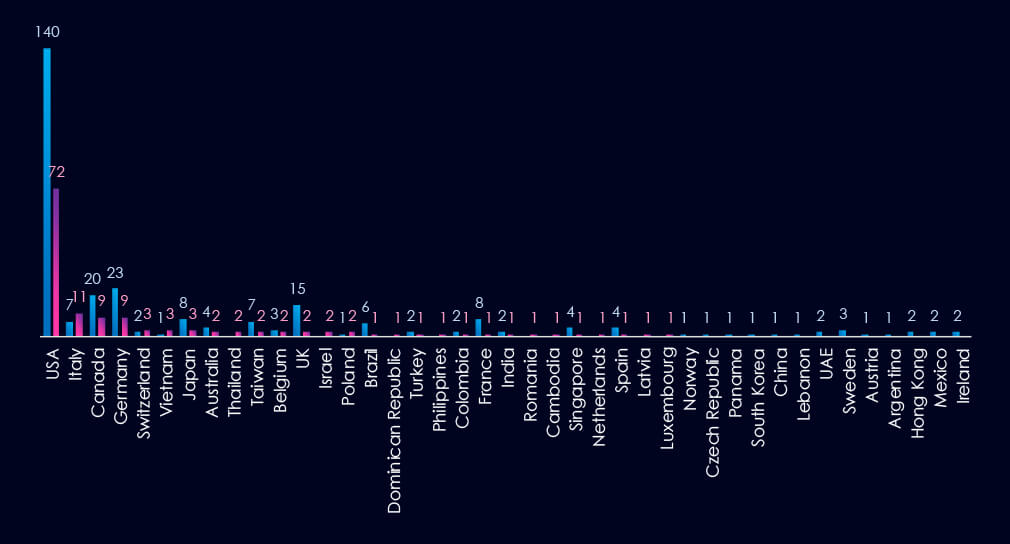
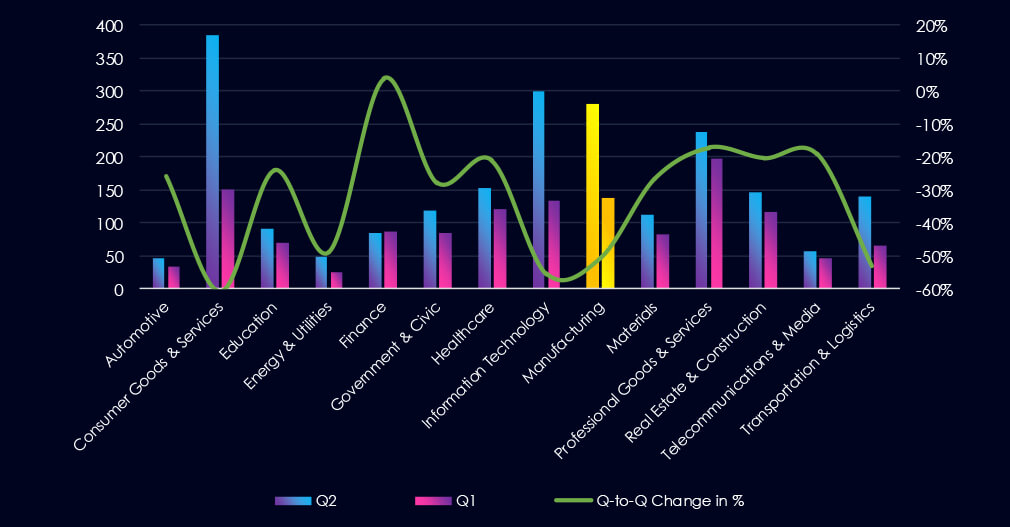
The chart shows quarter-to-quarter changes in targeted countries. Data is sorted by the last 90 days and compared to the previous 90 days, marked in blue.
In the last 90 days, the USA recorded 72 victims (52% of all victims). Canada, Germany, Japan, the UK, and France recorded significant drops from the previous 90-day period.

Manufacturing industry placed 3rd out of 14 monitored industries, recording 138 victims in the last 90 days, a significant decrease of -50% from 280 victims in the previous 90-day period.
Overall share also decreased, but more moderately, from 12.55% to 9.95% of all ransomware victims.
Monthly Activity Trends
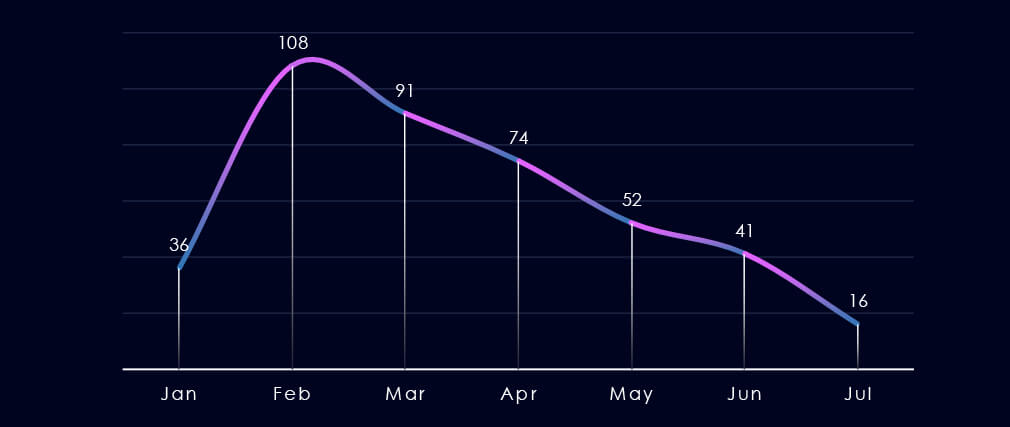
After a spike of activity in February, there was a remarkably linear drop in the number of manufacturing victims.
Ransomware Gangs
A total of 39 out of 72 active ransomware groups targeted this industry in the past 90 days, representing a 54% participation:
Play: The most active with 24 victims and 21.8% (24 out of 110) of all their victims.
Qilin: Second most active with 20 victims and a smaller 10.4% (20 out of 192) share.
Crypto24: Highest shares of 60% (3 out of 5) victims among the top 10 gangs.
Geographic Distribution
The geographic distribution of ransomware victims is relatively high yet heavily concentrated in the USA, accounting for 52% of all victims.
Notably, previously heavily hit countries like Canada, Germany, Japan, the UK, and France recorded a significant decline in victims.
In total, 28 countries recorded ransomware victims in this industry in the last 90 days, four fewer than 32 in the previous period.
For a comprehensive, up-to-date global ransomware tracking report, please refer to our new monthly “Tracking Ransomware” series here.
APT Campaigns (Low): Only 1 of 10 APT campaigns in the last 90 days targeted manufacturing (decline from 4/6 prior). The campaign in June showed overlapping techniques between China’s APT27 and North Korea’s Lazarus Group. Targets spanned Asia, the U.S., Europe, and the Middle East—including some Chinese and Macau-based entities. Web applications were the primary vector.
Underground & Dark Web Chatter (Low): Comprising 2.96% of total chatter, manufacturing ranked 10th among sectors. Data leaks and breaches peaked last period but remain high. Ransomware chatter rebounded slightly. Claimed hacks declined steadily. DDoS mentions rose again after a dip. Hacktivism saw renewed interest, possibly geopolitical. Web exploit mentions dropped significantly.
Vulnerabilities (Moderate): DoS flaws rose sharply, a concern for OT systems. RCE surged again (increase from 2 to 13), reaffirming its criticality. Memory issues rebounded; XSS and injection attacks remained low but steady. No new data leakage CVEs, but risk persists given high dark web chatter. Privilege escalation was minimal but remains a key post-exploit vector.
Ransomware (High): 138 victims (↓50% from 280 prior), ranking 3rd overall. Share dropped from 12.6% to 9.95%. Activity declined steadily after a February peak. 39 out of 72 active ransomware groups (54%) hit this sector. Play (24 victims) and Qilin (20) led in volume; Crypto24 had the highest group-specific share (60%). The USA accounted for 52% of all victims. Victim spread dropped to 28 countries (↓from 32), with notable declines in Canada, Germany, Japan, and the UK.