
The CYFIRMA Industry Report delivers original cybersecurity insights and telemetry-driven statistics of global industries, covering one sector each week for a quarter. This report focuses on the transportation & logistics industry, presenting key trends and statistics in an engaging infographic format.
Welcome to the CYFIRMA infographic industry report, where we delve into the external threat landscape of the transportation & logistics industry over the past three months. This report provides valuable insights and data-driven statistics, delivering a concise analysis of attack campaigns, phishing telemetry, and ransomware incidents targeting transportation & logistics organizations.
We aim to present an industry-specific overview in a convenient, engaging, and informative format. Leveraging our cutting-edge platform telemetry and the expertise of our analysts, we bring you actionable intelligence to stay ahead in the cybersecurity landscape.
CYFIRMA provides cyber threat intelligence and external threat landscape management platforms, DeCYFIR and DeTCT, which utilize artificial intelligence and machine learning to ingest and process relevant data, complemented by manual CTI research.
For the purpose of these reports, we leverage the following data from our platform. These are data processed by AI and ML automation, based on both human research input and automated ingestions.
Each attack campaign may target multiple organizations across various countries.
Campaign durations can vary from weeks to months or even years. They are sorted by the “last seen” date of activity to include the most relevant ones. Note that this may result in campaigns stacking up on later dates, affecting time-based trends.
Attribution to specific threat actors can be murky due to increasingly overlapping TTPs and commodity tools used. While suspected threat actors in this report are attributed with high confidence, we acknowledge the potential for inaccuracy.
This feature is still in development and matching algorithms are actively fine tuned. Some keywords/phrases that are essential for a specific industry are very common in cybercrime chatter, typically many IT terms. For the purpose of data gathering, we attempt a fine balance between accurate identification and removal of some keywords that trigger too many false positive detections.
While this report contains statistics and graphs generated primarily by automation, it undergoes thorough review and enhancement for additional context by CYFIRMA CTI analysts to ensure the highest quality and provide valuable insights.
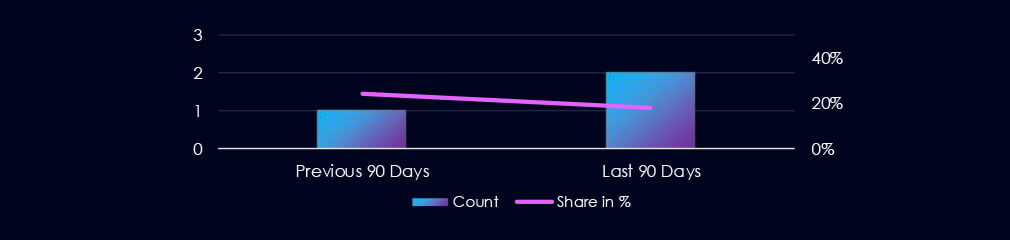
Over the past 90 days, the transportation & logistics industry featured in 2 out of the 11 observed campaigns, which is a presence in 18% of all campaigns. This is one more campaign than in the previous 90 days, however, a decline in overall share from 25% (1 out of 4).

Campaigns were observed during April and May respectively.

Observed campaigns were carried out by the Pakistani Transparent Tribe and an Algerian group called لميريب tracked as CCDZ2501. According to our research, this group is impersonating other APTs but shows signs of lower sophistication in their TTPs.
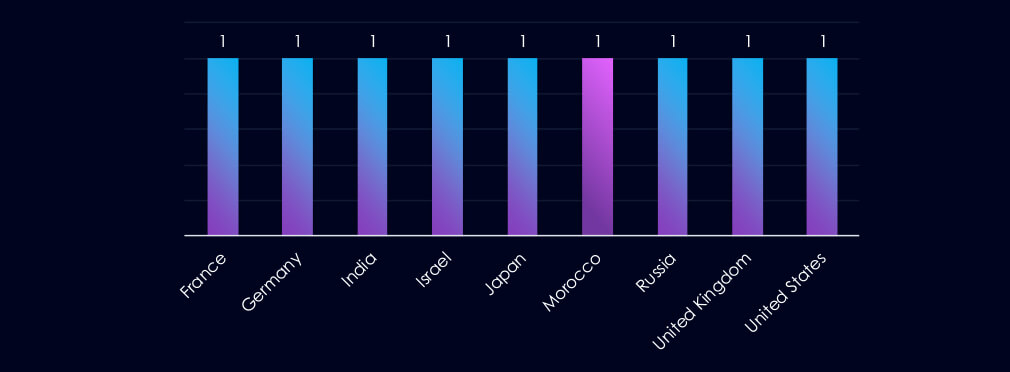
The transparent Tribe campaign targeted multiple countries listed above. The Algerian CCDZ2501 group targeted only victims in Morocco.
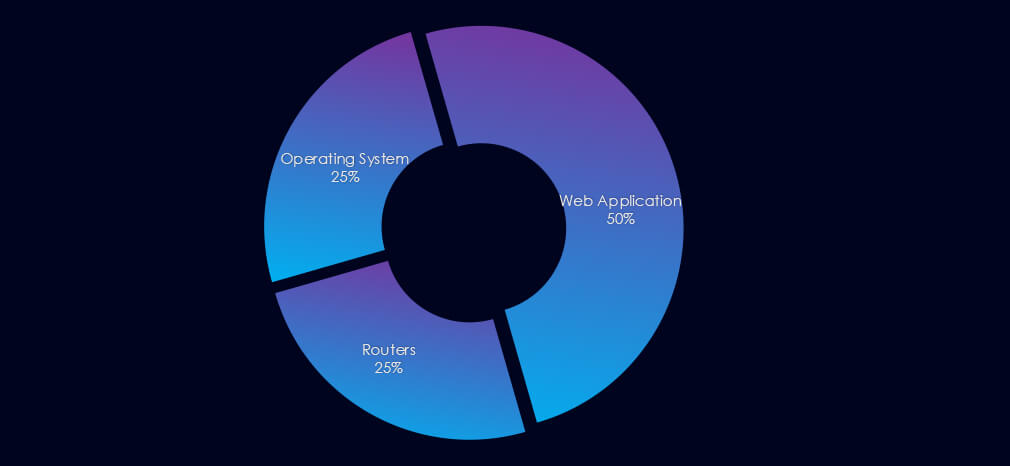
Both campaigns targeted Web Applications. Transparent Tribe also targeted operating systems and routers in their campaign.

Over the past 90 days, the transportation & logistics industry has not been significantly impacted by advanced persistent threat (APT) campaigns. Only 2 out of 11 observed APT campaigns recorded victims in this industry. That is an 18% presence in observed campaigns.
This figure surpasses the previous 90-day period, during which 1 campaign targeted this industry.
Monthly Trends
The observed campaigns were active during April and May.
Key Threat Actors
Campaigns were carried out by Pakistani Transparent Tribe and Algerian cybercriminal threat actors (لميريب) tracked as CCDZ2501.
Geographical Impact
The Transparent Tribe campaign affected a total of 8 countries. Algerian group focused only on victims in Morocco.
Targeted Technologies
Both campaigns targeted web applications, while Transparent Tribe also attacked operating systems and routers.
Over the past three months, CYFIRMA’s telemetry has identified 1,616 mentions of the transportation & logistics industry out of a total of 57,470 industry mentions. This is from a total of 300k+ posts across various underground and dark web channels and forums.
The transportation & logistics industry placed 11th out of 14 industries in the last 90 days with a share of 2.81% of all detected industry-linked chatter.
Below is a breakdown of 30-day periods of all mentions.
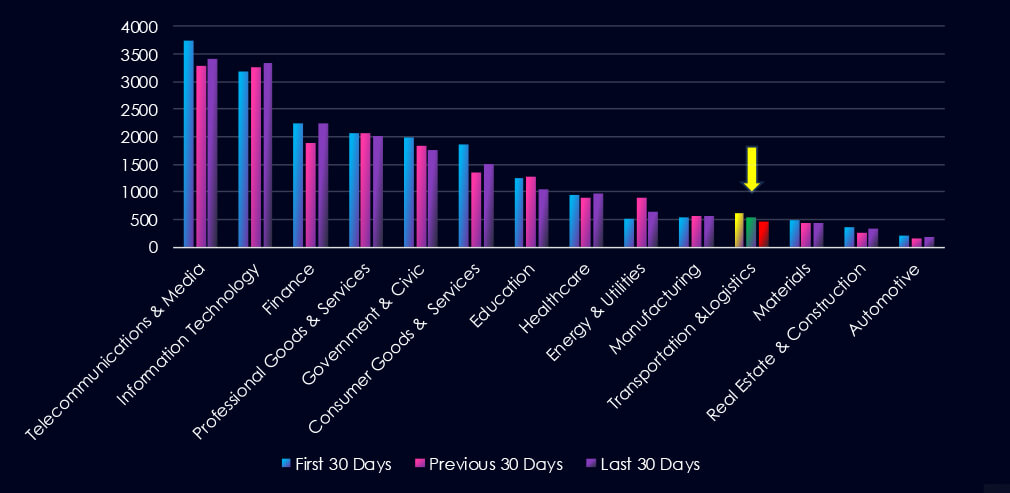
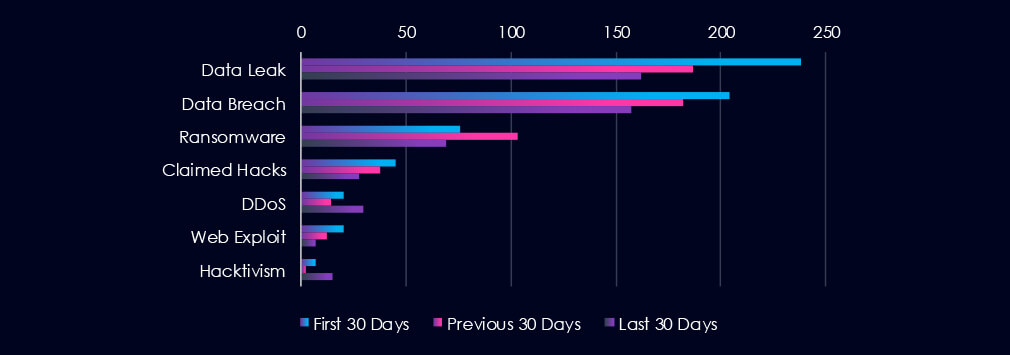
Data Leaks and Data Breaches are the most common category of recorded chatter for this industry. Ransomware chatter declined after the mild spike. DDoS and Hacktivism recorded upticks during the last 30 days.

In total, the transportation & logistics industry comprises 2.81% of all detected industry underground and dark web chatter in the last 90 days, ranking 11th out of 14 industries.
Below are the observed key trends across 90 days:
Steady Decline in Data Compromise Chatter
Data Leak: 238 → 187 → 162
Data Breach: 204 → 182 → 157
Indicates a gradual reduction in exposed or compromised data, though volumes remain concerning.
Ransomware Activity Peaked, Then Dropped
76 → 103 → 69
A spike in the middle period followed by a drop.
Claimed Hacks Trending Down
45 → 38 → 28
Fewer public breach declarations may indicate better containment or attackers shifting to covert exploitation rather than publicity.
Web Exploits Continuously Declining
20 → 12 → 7 (↓65% from start)
Suggests improved web security or reduced attacker interest in web-based entry points.
DDoS Resurgence in Recent Period
20 → 14 → 30 (↑50% from Jan)
Notable spikes could reflect targeted disruptions, especially in logistics systems where availability is.
Hacktivism Spiking Again
7 → 2 → 15 (↑650% from previous)
The sudden rise may be linked to political, labour, or environmental campaigns affecting transportation or supply chain systems.
Over the past three months, CYFIRMA’s telemetry has identified 87 mentions of the transportation & logistics industry out of a total of 2.707 industry mentions. This is from over 10k CVEs reported and updated in the last 90 days.
The transportation & logistics industry ranked 10th out of 14 industries in the last 90 days with a share of 3.21% of all detected industry-linked vulnerabilities.
Below is a breakdown of 30-day periods of all mentions.
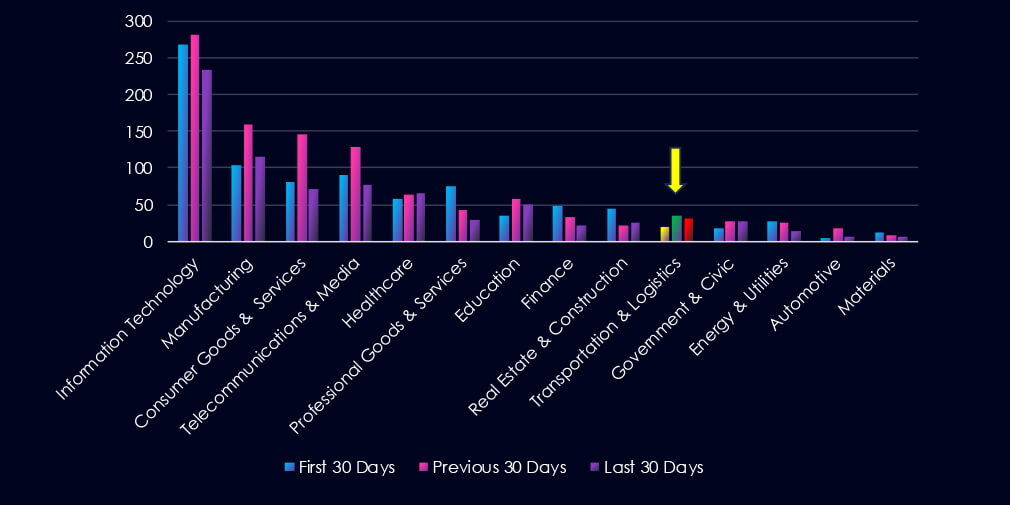
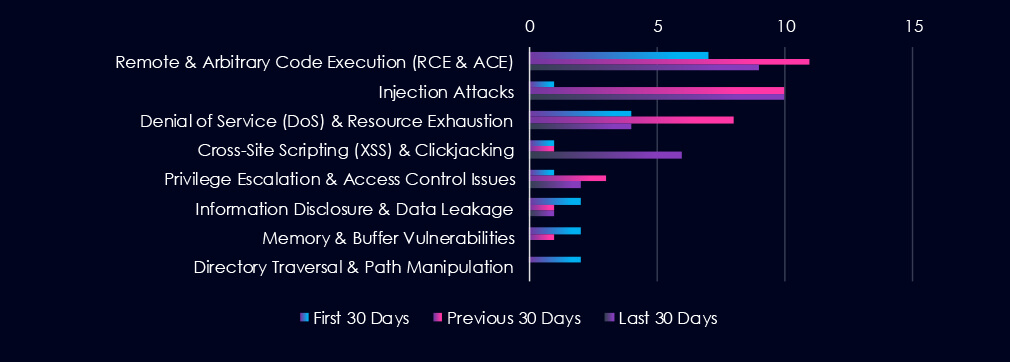
Remote & Arbitrary Code Execution (RCE & ACE) are leading the chart. Injection attacks and denial of service follow. Notable is the increase of RCE & ACE and DoS in the previous 90-day period, which has receded back during the last 90 days. XSS on the other hand rose sharply in the last 90 days.

In total, the transportation & logistics industry comprises 2.32% of all detected industry-linked vulnerabilities in the last 90 days, ranking 12th out of 14 industries.
Below are observed key trends across 90 days.
RCE Remains the Top Technical Threat
Remote Code Execution (RCE): 7 → 11 → 9
Consistently high, RCE is a critical risk for operational disruption, potentially enabling ransomware or backdoor access.
Injection Attacks Spiked and Stayed High
1 → 10 → 10
Major increases and sustained volume point to web-facing system vulnerabilities, like APIs or logistics portals.
DoS Vulnerabilities Fluctuating
4 → 8 → 4
Matches rising DDoS chatter, indicating attackers may exploit both volumetric attacks and protocol weaknesses.
XSS Risk Increasing
1 → 1 → 6
Cross-Site scripting is seeing a small resurgence, likely tied to vulnerable front-end applications or user interfaces in platforms like shipment tracking or client dashboards.
Privilege Escalation & Access Control
1 → 3 → 2
A modest but ongoing concern—internal access abuse or lateral movement is possible if left unpatched.
Other Vulnerabilities Quieting Down
Memory & Buffer: 2 → 1 → 0
Directory Traversal: 2 → 0 → 0
In the past 90 days, CYFIRMA has identified 62 verified ransomware victims in the transportation & logistics industry. This accounts for 4.1% of the overall total of 1,514 ransomware victims during the same period, placing the transportation & logistics industry 11th out of 14 industries.
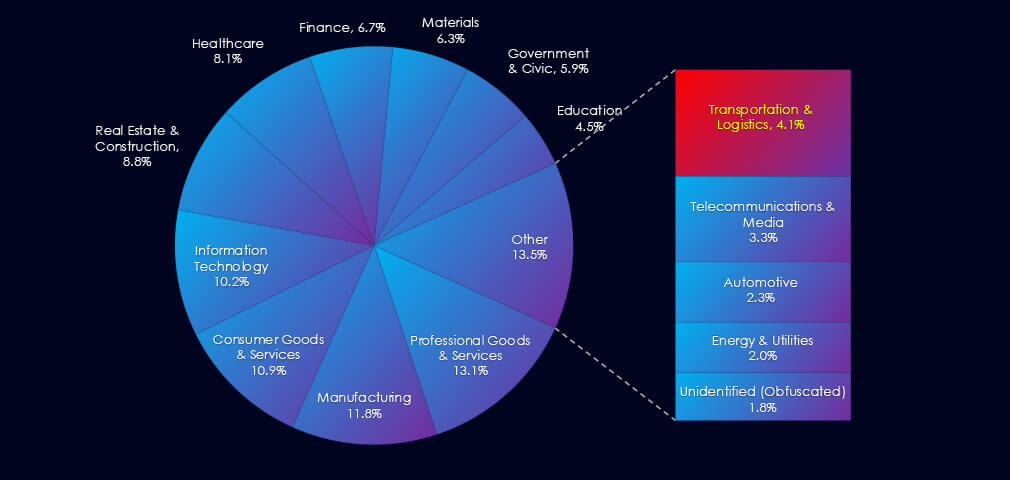
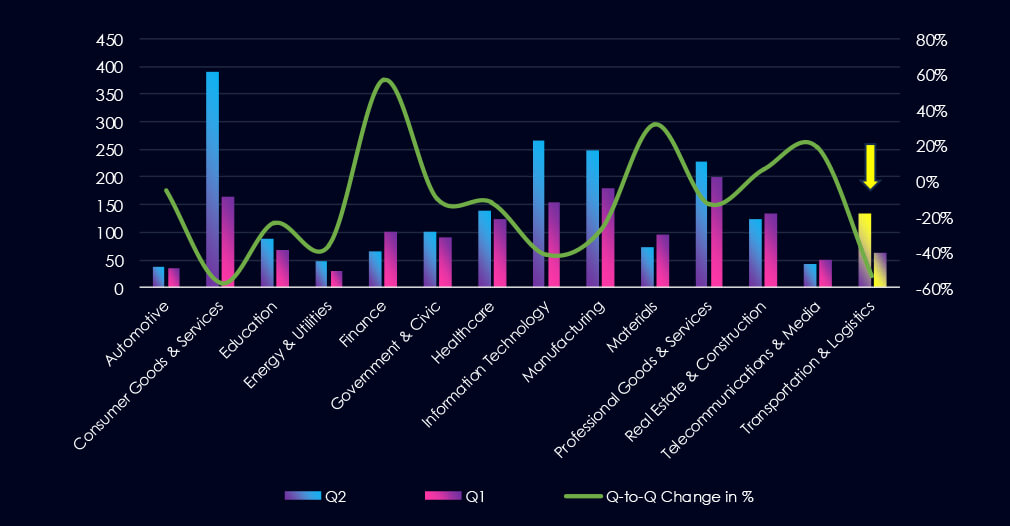
Furthermore, a quarterly comparison reveals a major decrease of interest in transportation & logistics organizations of -53.4% from 132 to 62 victims. The overall share also dropped from 6.6% to 4.1% of all victims.
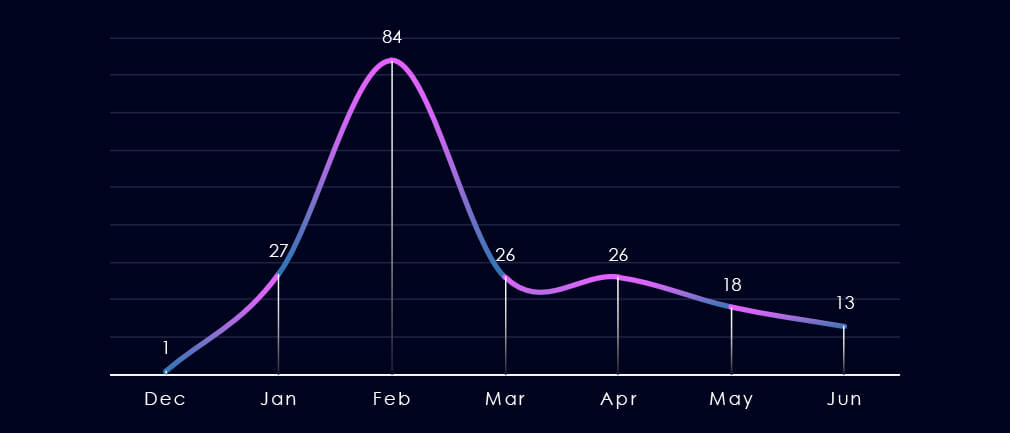
Over the past 180 days, we have observed one significant spike in activity but generally sustained activity following the February spike.
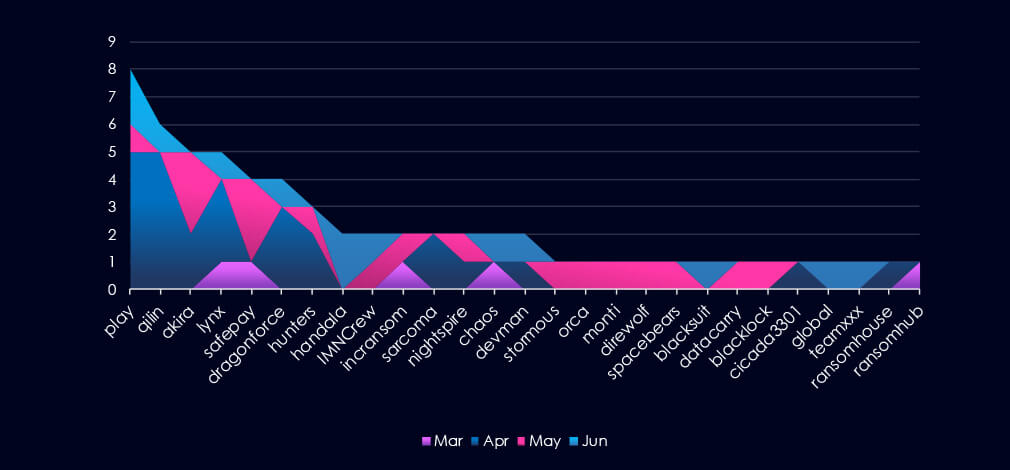
A breakdown of monthly activity per gang provides insights into which gangs were active each month. For example, the two most active gangs Play and Qilin, were highly active during April. On the other hand, Akira and Safepay recorded the most victims in May.
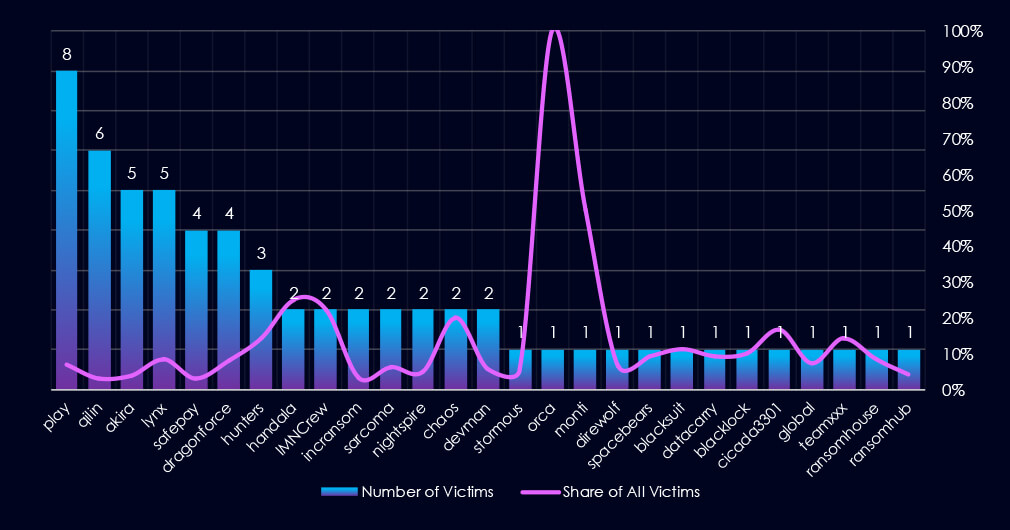
Out of the 73 gangs, 27 recorded victims in this industry in the last 90 days (37% participation). Play had the highest number of victims (8).
The share of victims for most gangs in this industry is low. Only 3 of the top 10 gangs recorded 10% or more of the victims in this industry while 4 have below 5%.
Among the top 10 gangs, Handala (25%), IMNCrew (22%), and Hunters (14%) recorded high shares in this industry, however, they recorded overall low numbers of victims.
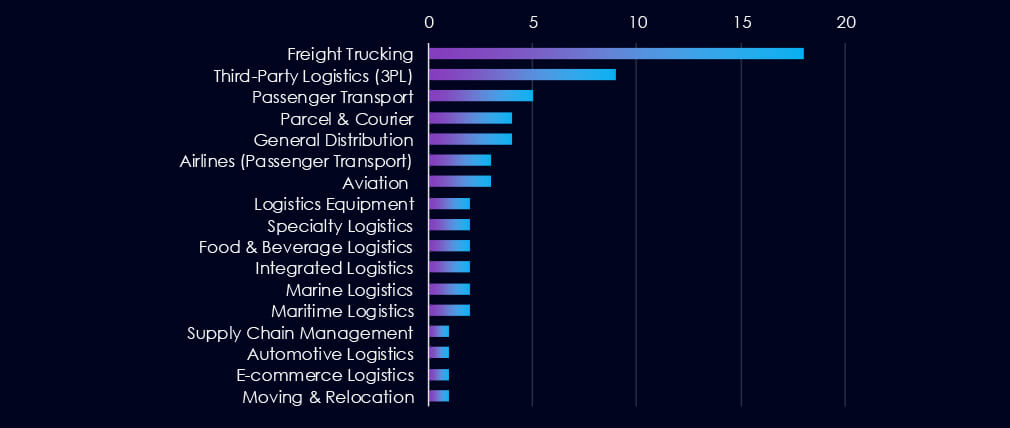
Freight trucking is the most frequent victim of ransomware in this industry. Third-party logistics and passenger transport follow in second and third place.
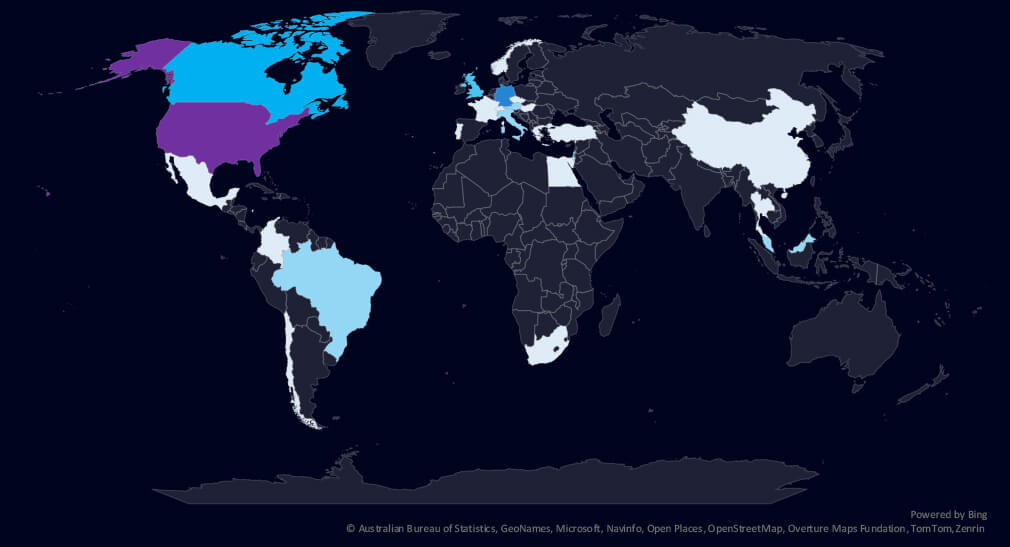
The geographic distribution heatmap underscores the widespread impact of ransomware, highlighting the countries where victims in this industry have been recorded.
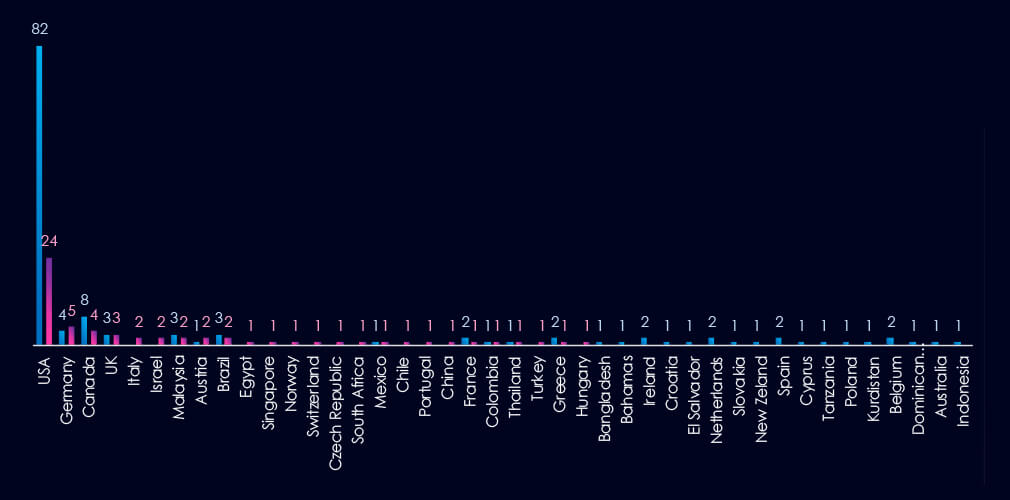
The chart shows quarter-to-quarter changes in targeted countries. Data is sorted by the last 90 days and compared to the previous 90 days, marked in blue.
In the last 90 days, the USA recorded 24 victims, nearly a quarter of the previous period and representing 39% of all victims. Germany and Canada follow in the top three. Comparing the blue and pink numbers on the chart above, we can see a decrease in the number of countries affected and many countries that were previously affected but are no longer so.

The transportation & logistics industry placed 11th out of 14 monitored industries recording 62 victims in the last 90 days, a major decrease of -53% from 132 victims in the previous 90-day period.
Overall share also dropped from 6.6% to 4.1% of all ransomware victims.
Monthly Activity Trends
The monthly activity was remarkable across the last 180 days, however, we observed a significant spike in February.
The transportation & logistics industry is not a very frequent target of ransomware most likely due to largely analogue operations.
Ransomware Gangs
A total of 27 out of 73 active ransomware groups targeted this industry in the past 90 days – 37% participation:
Play: The most active with 8 victims and 7% (8 out of 113) victims.
Handala, IMNCrew: Highest shares of 25% (2 out of 8) and 22% (2 out of 9) victims among the top 10 gangs.
Geographic Distribution
The geographic distribution of ransomware victims is relatively high and spread across the globe. The USA (24) accounts for 39% of all victims, followed by Germany (5) and Canada (4). Notably USA victims dropped from 82 to just 24 between 90 days periods.
In total, 25 countries recorded ransomware victims in this industry in the last 90 days, four less than 29 in the previous period.
For a comprehensive, up-to-date global ransomware tracking report, please refer to our new monthly “Tracking Ransomware” series here.
APT Campaigns (Low): The industry saw limited APT targeting, with only 2 of 11 observed campaigns (18%) recording victims—an increase from just one campaign in the prior period. Activity occurred in April and May, involving Transparent Tribe (Pakistan) and an Algerian threat actor (CCDZ2501). Transparent Tribe’s campaign spanned 8 countries, while CCDZ2501 focused solely on Morocco. Targets included web apps, operating systems, and routers.
Underground & Dark Web Chatter (Low): Transportation & logistics accounted for 2.81% of total chatter, ranking 11th. Data leak and breach mentions steadily declined, while ransomware chatter peaked mid-period before dropping. Claimed hacks also declined. Web exploit chatter fell 65%, suggesting improved perimeter defenses. However, DDoS activity surged by 50%, and hacktivism spiked by 650%, likely tied to political or labor-related actions affecting the sector.
Vulnerabilities (Low): The sector ranked 12th in CVE volume, making up just 2.32% of observed vulnerabilities. RCE remained the top technical risk, followed by a sharp and sustained increase in injection attacks. DoS vulnerabilities rose and fell in line with DDoS chatter. XSS vulnerabilities increased modestly. Other vectors like memory flaws and directory traversal appear dormant.
Ransomware (Low): Ransomware incidents fell by 53% to 62 victims, dropping the industry to 11th place in volume. The share of all ransomware victims declined to 4.1%. Activity spiked in February but remained low otherwise. 27 ransomware groups targeted the sector, with Play (8 victims) the most active. Handala and IMNCrew had the highest industry-specific targeting shares. USA accounted for 39% of victims, but incidents dropped sharply from 82 to 24. Victims were spread across 25 countries, down from 29.