
The CYFIRMA Industry Report delivers original cybersecurity insights and telemetry-driven statistics of global industries, covering one sector each week for a quarter. This report focuses on the Healthcare Industry, presenting key trends and statistics in an engaging infographic format.
Welcome to the CYFIRMA infographic industry report, where we delve into the external threat landscape of the Healthcare Industry over the past three months. This report provides valuable insights and data-driven statistics, delivering a concise analysis of attack campaigns, phishing telemetry, and ransomware incidents targeting healthcare organizations.
We aim to present an industry-specific overview in a convenient, engaging, and informative format. Leveraging our cutting-edge platform telemetry and the expertise of our analysts, we bring you actionable intelligence to stay ahead in the cybersecurity landscape.
CYFIRMA provides cyber threat intelligence and external threat landscape management platforms, DeCYFIR and DeTCT, which utilize artificial intelligence and machine learning to ingest and process relevant data, complemented by manual CTI research.
For the purpose of these reports, we leverage the following data from our platform. These are data processed by AI and ML automation based on both human research input and automated ingestions.
While this report contains statistics and graphs generated primarily by automation, it undergoes thorough review and enhancement for additional context by CYFIRMA CTI analysts to ensure the highest quality and provide valuable insights.
The healthcare industry did not feature in any of the 8 observed campaigns, which is a presence in 0% of all campaigns, same as the previous period (0 out of 5, 0%) in both volume and overall share.
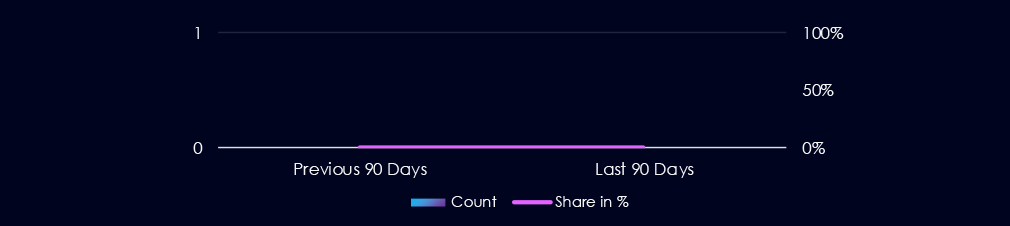

No campaigns with healthcare-related victims were observed since the end of September in our telemetry.

Over the past 90 days, the healthcare industry has not been significantly impacted by advanced persistent threat (APT) campaigns.
The healthcare industry is not currently a frequent target of APT (Advanced Persistent Threat) actors due to its comparatively low strategic value in the context of state-sponsored cyber operations. Unlike sectors such as defense, energy, or finance—which hold sensitive geopolitical, economic, or technological data—healthcare organizations typically manage data with limited intelligence or national security utility.
Another factor is operational risk: targeting healthcare systems, particularly hospitals, can carry reputational or diplomatic consequences, especially if lives are endangered. While financially motivated actors like ransomware groups continue to exploit healthcare for extortion, nation-state APTs tend to avoid such targets unless specific biotechnological research, pandemic data, or government-affiliated medical institutions are involved. As a result, healthcare remains a peripheral focus for most APT campaigns.
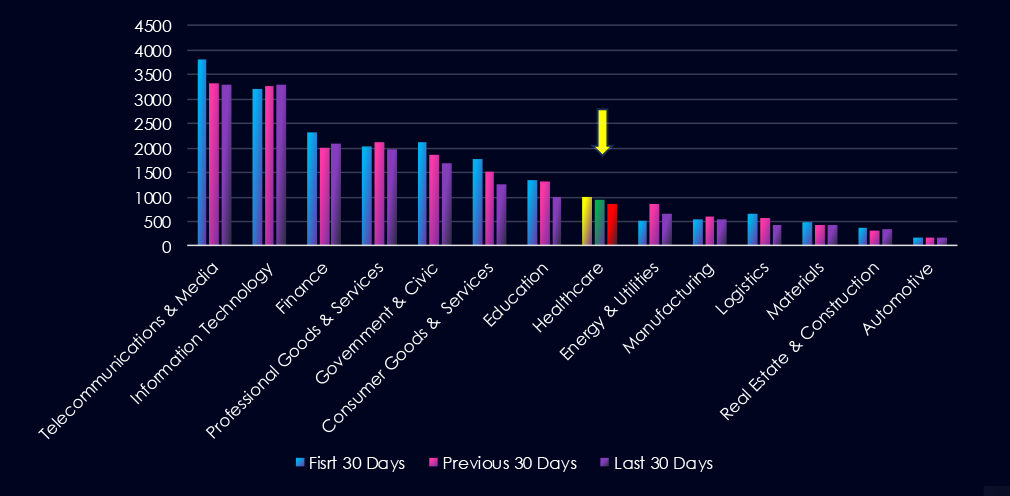
Over the past three months, CYFIRMA’s telemetry has identified 2,789 mentions of the healthcare industry out of a total of 57,633 industry mentions. This is from a total of 300k+ posts across various underground and dark web channels and forums.
The healthcare industry placed 8th out of 14 industries in the last 90 days with a share of 4.84% of all detected industry-linked chatter.
Below is a breakdown of 30-day periods of all mentions.

Data Breaches and Data Leaks are the most common category of recorded chatter in this industry. Ransomware-related chatter follows in close third place.

In total, the healthcare industry comprises 4.84% of all detected industry underground and dark web chatter in the last 90 days. And ranking 8th out of 14 industries.
Below are observed key trends across 90 days:
Gradual Decline in Data Breach Mentions
348 → 323 → 288 (↓17% from start)
Indicates a slow but steady reduction in breach-related chatter.
Data Leak Mentions Stabilizing
323 → 271 → 281
After a dip in the previous period, data leak chatter slightly rebounded.
Ransomware Threat Still High and Steady
198 → 220 → 215
Despite fluctuations, ransomware remains consistently high.
Claimed Hacks Declining
56 → 55 → 44
Suggests a reduction in publicized or extortion-driven breaches.
Hacktivism Collapsed
20 → 33 → 6 (↓82% from previous period)
A sharp decline likely signals a shift away from ideological targeting.
DDoS Activity Volatile but Lower
13 → 26 → 16
Still a viable threat to service availability.
Web Exploits Trending Down
33 → 11 → 9 (↓73% overall)
Reflects improved web app security or attacker shift toward other tactics, like phishing or ransomware.
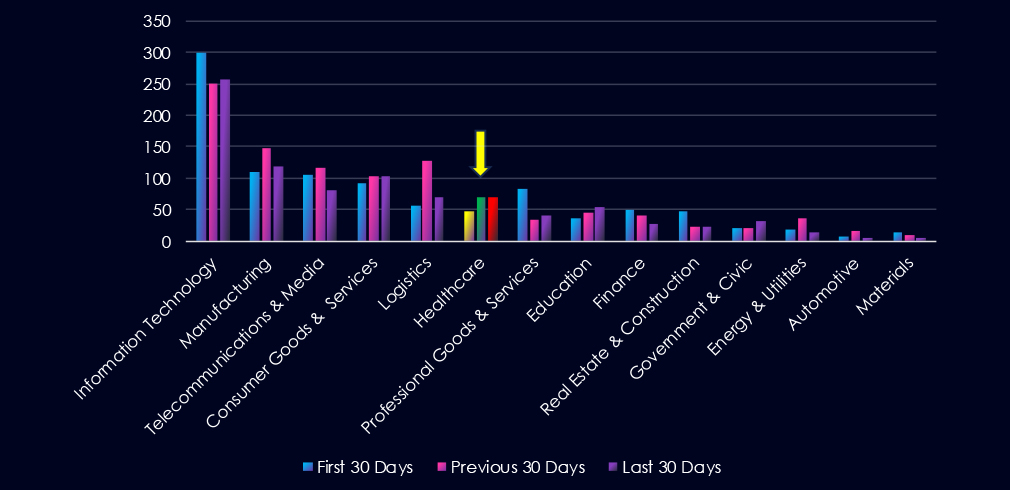
Over the past three months, CYFIRMA’s telemetry has identified 187 mentions of healthcare industry out of a total of 2.927 industry mentions. This is from over 10k CVEs reported and updated in last 90 days.
Healthcare industry ranked 6th out of 14 industries in the last 90 days with a share of 6.39% of all detected industry linked vulnerabilities.
Below is a breakdown of a 30-day period of all mentions.
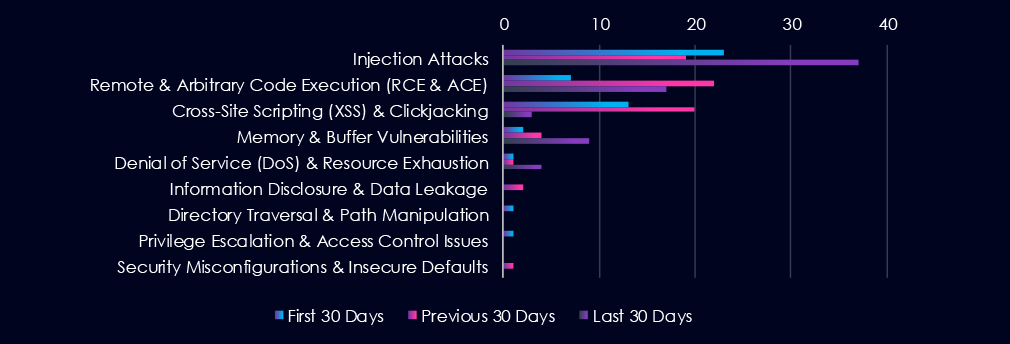
Injection Attacks are the most frequent vulnerability. Remote & Arbitrary Code Execution (RCE & ACE) and Cross-Site Scripting (XSS) & Clickjacking are following in second and third place. Notable is increase of Injection Attack and Memory & Buffer CVEs in the last 30 days while RCE and XSS decreased.

In total, healthcare industry comprise of 6.39% of all detected industry-linked vulnerabilities in the last 90 days, ranking 6th out of 14 industries.
Below are the observed key trends across 90 days.
Injection Attacks Surged in March
23 → 19 → 37 (↑61% from previous)
Indicates renewed attacker focus on input vulnerabilities, possibly in patient portals, EHR systems, or third-party services.
RCE Still a Major Threat Despite Dip
7 → 22 → 17
While slightly down from peak, Remote Code Execution remains one of the most dangerous vulnerabilities.
XSS Dropped Sharply
13 → 20 → 3
A major drop in March suggests possible hardening of web applications, or attacker focus shifting elsewhere.
Memory/Buffer Vulnerabilities Increasing
2 → 4 → 9
Rising trend could signal more vulnerabilities discovered in legacy systems or device software, including medical equipment or backend infrastructure.
DoS Vulnerabilities Climbing
1 → 1 → 4
Although still low-volume, this aligns with recent DDoS chatter, raising concern for service disruption risks in critical systems.
In the past 90 days, CYFIRMA has identified 130 verified ransomware victims in healthcare industry. This accounts for 8.1% of the overall total of 1,605 ransomware victims during the same period, placing the healthcare industry 6th out of 14 industries.
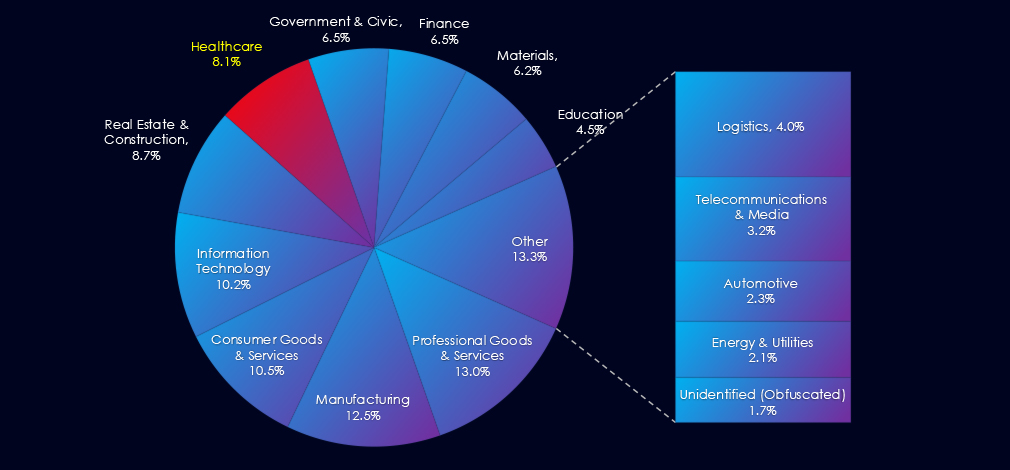
Furthermore, a quarterly comparison reveals that interest in healthcare organizations remained nearly the same, only a minor change of -1.5% from 132 to 130 victims. The overall share however slightly increased from 6.64% to 8.1% of all victims.
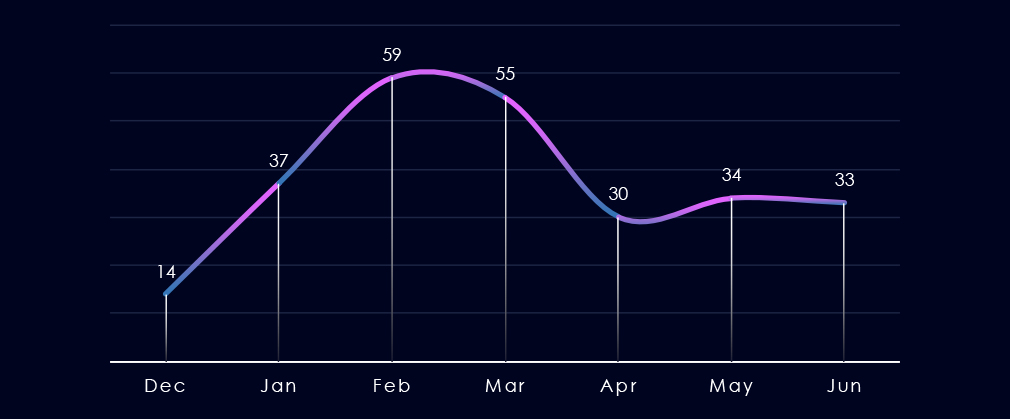
Over the past 180 days, we have observed elevated activity during February and March. Given that we are currently in the middle of June, it appears elevated activity has re-occurred as the number of victims are already matching the previous two months.
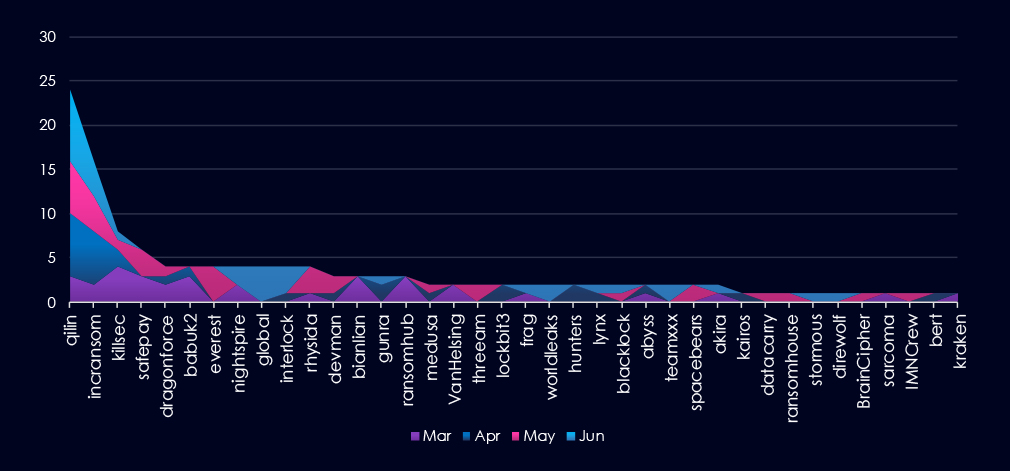
A breakdown of monthly activity per gang provides insights into which gangs were active each month. For example, the most active gangs, Qilin and Incransom, were highly active across all months. On the other hand, gangs like Everest recorded victims only during one month.
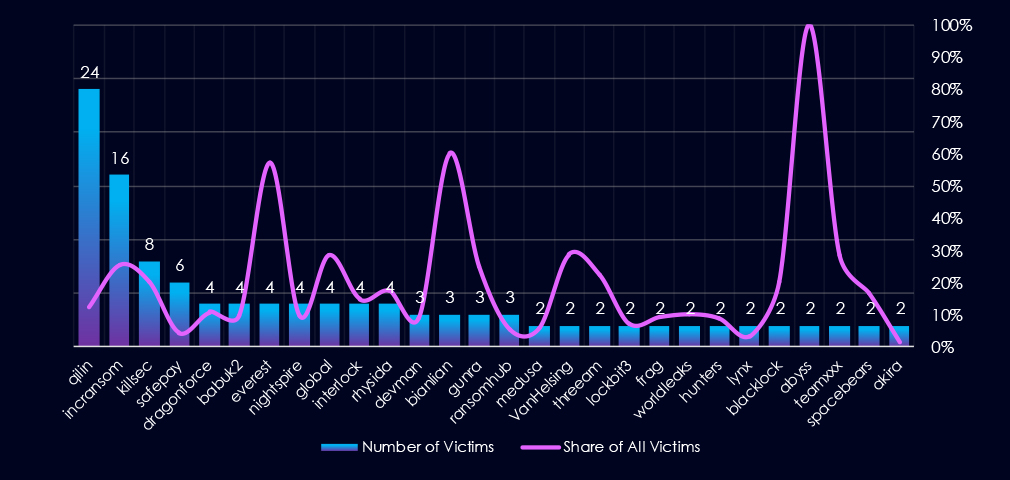
Out of the 76 gangs, 38 recorded victims in this industry in the last 90 days (50% participation). Qilin had the highest number of victims (24).
Most worrying is the statistic of the overall share of victims for each gang. Many gangs show a high focus on the healthcare industry, suggesting a primary focus.
Among the top 5 gangs, Qilin (12.2%), Incransom (25.4%), and Killsec (20%) recorded high shares in this industry. Furthermore, Everest (57.1%) and Bianlian (60%) show extremely high focus. Out of the top 20 gangs, 12 show double-digit % of victims in the healthcare industry.
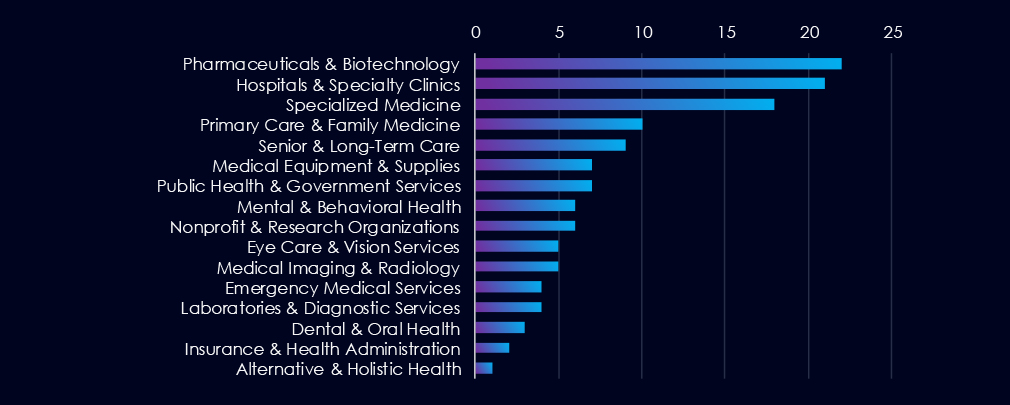
Pharma & Biotech and Hospitals & Clinics are the most frequent victims of ransomware in this industry. Furthermore, Primary Care and Senior Care are also frequently targeted.
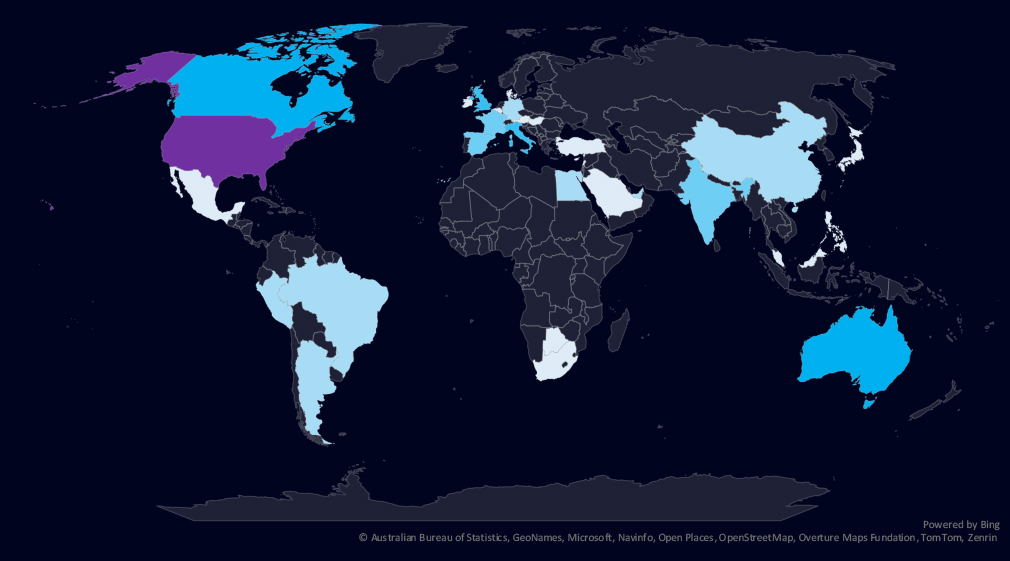
The geographic distribution heatmap underscores the widespread impact of ransomware, highlighting the countries where victims in this industry have been recorded.
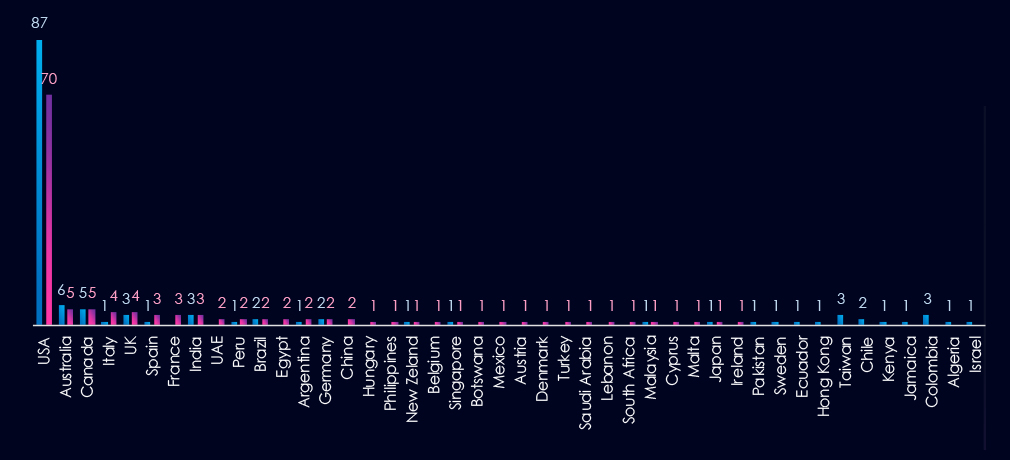
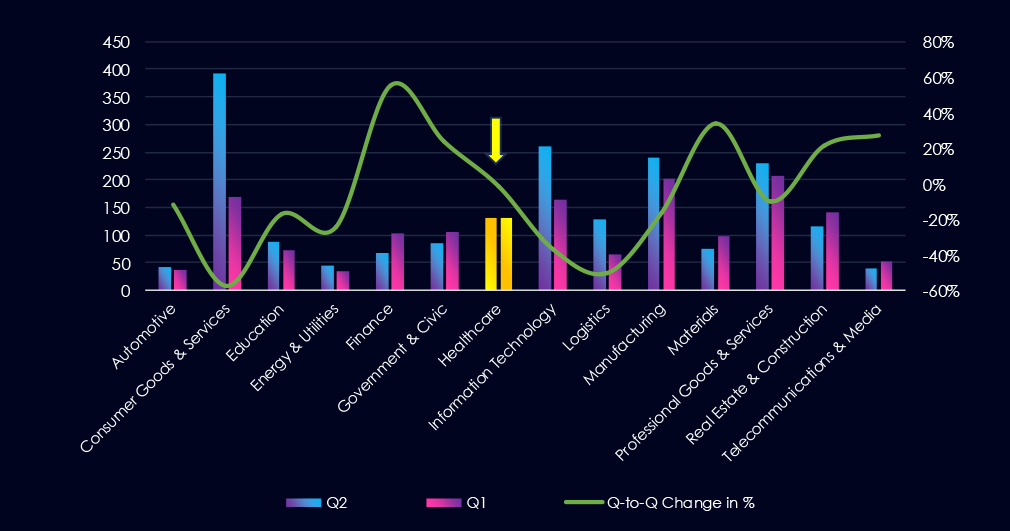
The chart shows quarter-to-quarter changes in targeted countries. Data is sorted by the last 90 days and compared to the previous 90 days marked in blue.
Healthcare victimology is completely dominated by the US for-profit healthcare sector. 54% of all victims are from the USA. Australia, Canada, Italy, and the UK follow in the top 5.

The healthcare industry placed 6th out of 14 monitored industries recording 130 victims in the last 90 days, a minor decrease of -1.5% from 132 victims in the previous 90 days period.
However, the overall share increased from 6.54% to 8.1% of all ransomware victims.
Monthly Activity Trends
Monthly activity fluctuated across the last 180 days with elevation during March and February.
Healthcare industry ransomware activity is highly localized in the USA due to its for-profit model. The USA warrants high risk, while the rest of the world is moderate to low.
Ransomware Gangs
A total of 38 out of 76 active ransomware groups targeted this industry in the past 90 days – a 50% participation:
Qilin: The most active with 24 victims and 12.2% (24 out of 196) victims.
IncRansom, Killsec: Highest shares in the top 5, 25.4% (16 out of 63) and 20% (8 out of 40) victims among the top gangs.
Everest, Bianlian: Extremely high share of healthcare victims (57% and 60%) showing healthcare is their primary focus.
Geographic Distribution
The geographic distribution of ransomware victims is relatively high and spread across the globe. However, as mentioned the USA dominates with 70 victims accounting for 54% of all ransomware victims in this industry, followed by Australia (5), Canada (5), Italy (4), and the UK (4) in the top 5.
In total, 33 countries recorded ransomware victims in this industry in the last 90 days, an increase from 26 in the previous period.
For a comprehensive, up-to-date global ransomware tracking report, please refer to our new monthly “Tracking Ransomware” series here.
APT Campaigns (Low): The healthcare industry remains a peripheral target for advanced persistent threat (APT) actors. None of the past 90-day APT campaigns explicitly targeted this sector. This trend reflects the sector’s low geopolitical and strategic intelligence value, especially when compared to finance or defense. Additionally, targeting hospitals and critical healthcare systems carries reputational and diplomatic risks, which discourages state-sponsored operations unless tied to specific research or pandemic surveillance.
Underground & Dark Web Chatter (Moderate): Healthcare accounted for 4.84% of all dark web and underground chatter over the past 90 days, ranking 8th. Data breach mentions declined by 17%, while data leak chatter stabilized. Ransomware mentions remained consistently high, showing its ongoing threat. Hacktivism collapsed by 82% and claimed hacks also fell. DDoS activity was volatile but trended downward. Web exploit mentions declined by 73%, suggesting improved defensive posture or shifts in attacker priorities.
Vulnerabilities (Moderate): Healthcare ranked 6th in detected CVEs, making up 6.39% of industry-linked vulnerabilities. Injection attacks surged in March, likely targeting EHR systems or patient portals. Remote Code Execution (RCE) remains a high-risk vector despite a slight decline. Cross-site scripting (XSS) dropped sharply, while memory/buffer flaws increased, possibly due to aging infrastructure and medical device software. Denial of Service (DoS) vulnerabilities also grew, aligning with a modest DDoS threat profile.
Ransomware (Moderate*): With 130 incidents, healthcare ranked 6th by ransomware volume—down slightly from 132 but now making up 8.1% of all victims. Activity remained elevated in February and March. U.S. organizations represented 54% of all attacks, driven by their privatized, for-profit healthcare model. Of 76 ransomware groups, 38 (50%) targeted this industry. Qilin, IncRansom, and Killsec were most active by volume and share, while Everest and Bianlian showed an exclusive focus on healthcare. Victims spanned 33 countries, up from 26 since the last period.