

The CYFIRMA Industry Report delivers original cybersecurity insights and telemetry-driven statistics of global industries, covering one sector each week for a quarter. This report focuses on the information technology industry, presenting key trends and statistics in an engaging infographic format.
Welcome to the CYFIRMA infographic industry report, where we delve into the external threat landscape of the information technology industry over the past three months. This report provides valuable insights and data-driven statistics, delivering a concise analysis of attack campaigns, phishing telemetry, and ransomware incidents targeting the information technology industry.
We aim to present an industry-specific overview in a convenient, engaging, and informative format. Leveraging our cutting-edge platform telemetry and the expertise of our analysts, we bring you actionable intelligence to stay ahead in the cybersecurity landscape.
CYFIRMA provides cyber threat intelligence and external threat landscape management platforms, DeCYFIR and DeTCT, which utilize artificial intelligence and machine learning to ingest and process relevant data, complemented by manual CTI research.
For the purpose of these reports, we leverage the following data from our platform. These are data processed by AI and ML automation based on both human research input and automated ingestions.
While this report contains statistics and graphs generated primarily by automation, it undergoes thorough review and enhancement for additional context by CYFIRMA CTI analysts to ensure the highest quality and provide valuable insights.
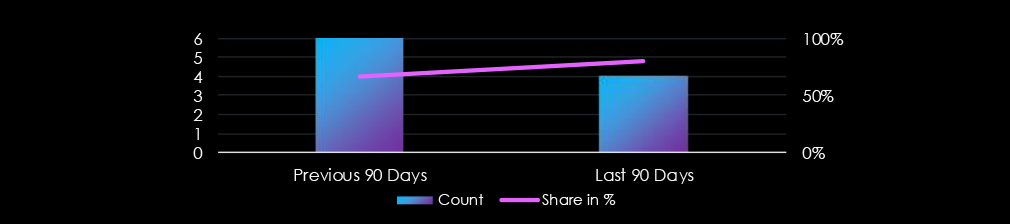
Information technology organizations did feature in 4 of the 5 observed campaigns, which is a presence in 80% of all campaigns, a decrease from 6 campaigns in the previous period, however, an increase in overall share from 66% presence.

February and March recorded 2 campaigns each. January and April so far did not record any telco & media victims.
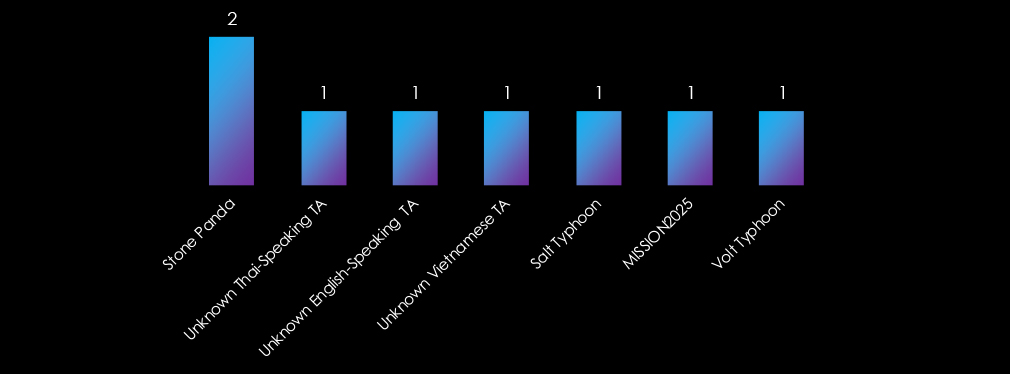
The observed campaigns are evenly divided between Chinese nation-state threat actors and Unattributed threat actors who share overlapping Tactics, Techniques, and Procedures (TTPs).
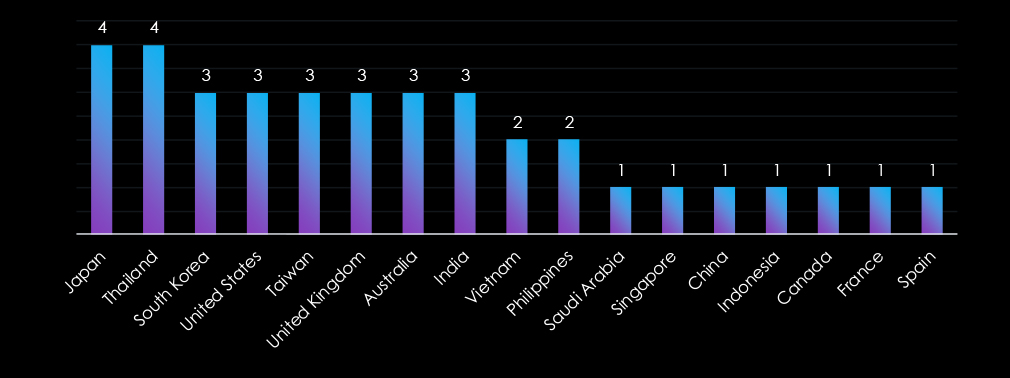
Victims of the observed attack campaigns have been reported in 17 different countries. Japan and Thailand have reported victims in all four campaigns. Notably, most of the countries listed align with known points of interest associated with threat actor-linked countries, primarily in the Asia-Pacific region.
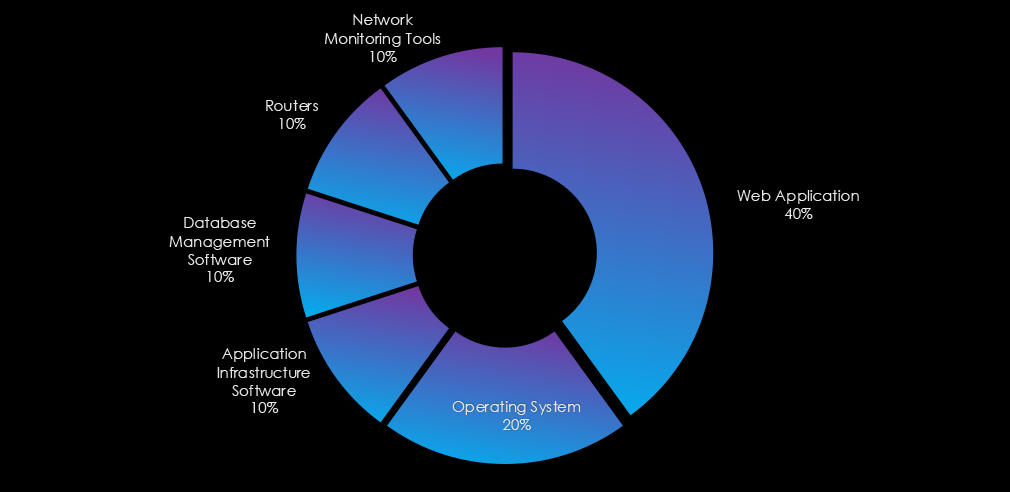
All four observed campaigns targeted web applications, two targeted operating systems and we have also seen application infrastructure, database management, routers and network monitoring tools.

In the past 90 days, information technology organizations have been significantly impacted by advanced persistent threat (APT) campaigns. Four in five observed APT campaigns targeted the IT industry, representing 80% of the total. This is two less than the previous 90-day period when six out of nine campaigns targeted the IT industry.
Monthly Trends:
The observed campaigns occurred during February and March, both months recording two campaigns.
Key Threat Actors:
The attribution of the campaigns is split in half between Chinese nation-state threat actors and unattributed Vietnamese and Thai-speaking threat actors.
Geographical Impact:
The campaigns have affected a total of 17 countries. Notably, Japan and Thailand were targeted in all four observed campaigns.
Targeted Technologies:
Web applications were targeted in all four campaigns while operating systems were targeted in two. Additionally, application infrastructure, routers, network monitoring tools, and database management software were targeted.
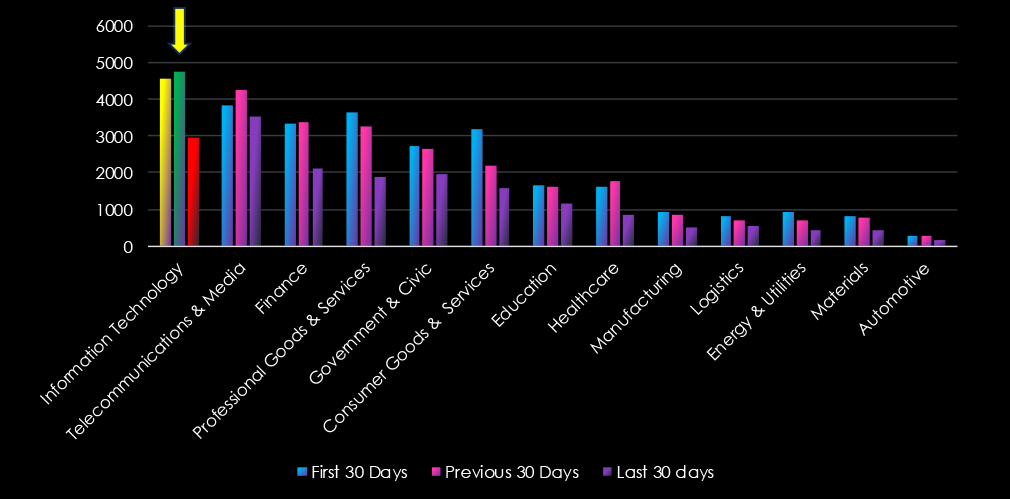
Over the past three months, CYFIRMA’s telemetry has identified 12,259 mentions of information technology out of a total of 73,561 industry mentions. This is from total of 558,920 posts across various underground and dark web channels and forums.
Information technology is the most frequently mentioned out of 13 industries in the last 90 days with a share of 16.67% of all detected industry chatter. This is only natural due to IT infrastructure being a primary cybersecurity realm.
Below is a breakdown of 30-days periods of all mentions.
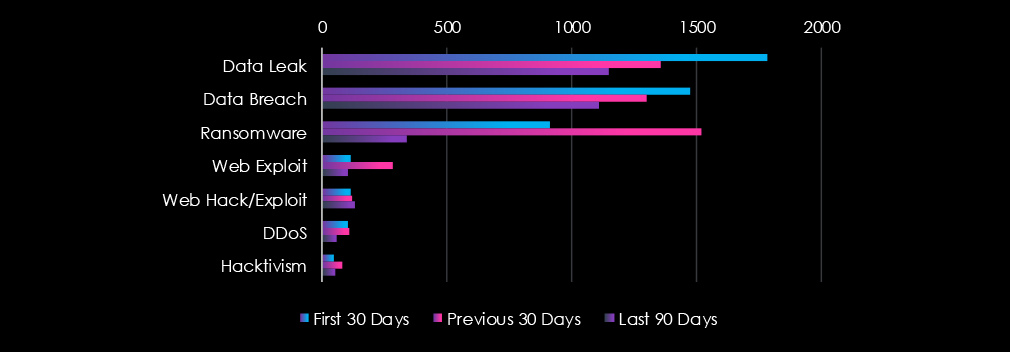
Data leaks and data breaches, were the most common categories of recorded chatter for the IT industry. Also notable is an increase of ransomware chatter during March.

In total, information technology comprises 16.67% of all detected industry underground and dark web chatter in the last 90 days, ranking 1st out of 13 industries.
Below are observed key trends across 90 days:
Sustained Threat Levels, with Recent Decline
Data Leak: 1786 → 1356 → 1151
Data Breach: 1476 → 1300 → 1110
Both show a gradual decline over time but remain high, indicating ongoing data exposure.
Ransomware Surged and Then Crashed
911 → 1520 → 337 (↓78% from peak)
A massive mid-period spike, followed by a significant drop in the last 90 days.
Web-Based Threats Still Active
Web Exploit: 115 → 284 → 104 (↘ after a peak)
Web Hack/Exploit: 116 → 120 → 131 (↑13%)
Suggests attackers are still probing and exploiting web systems, even if total mentions dropped slightly.
DDoS & Hacktivism Moderate
DDoS: 104 → 106 → 56 → Declining trend
Hacktivism: 45 → 81 → 50 → Spikes appear campaign/event-driven
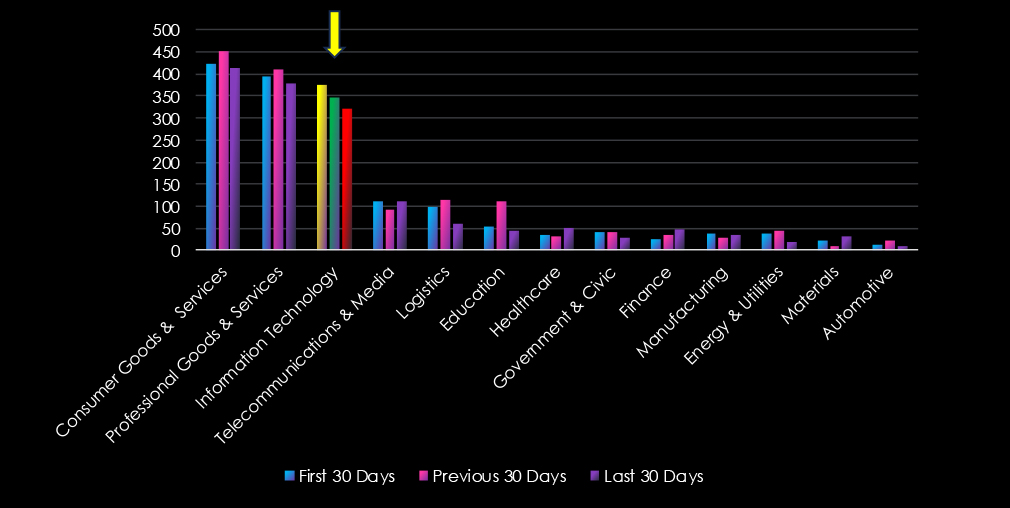
Over the past three months, CYFIRMA’s telemetry has identified 1,044 mentions of the information technology industry out of a total of 4,962 industry mentions. This is from a total of 11,748 CVEs published in 90 days.
IT industry ranked 3rd out of 13 industries in the last 90 days with a share of 21.04% of all detected industry-linked vulnerabilities.
Below is a breakdown of 30-day periods of all mentions.
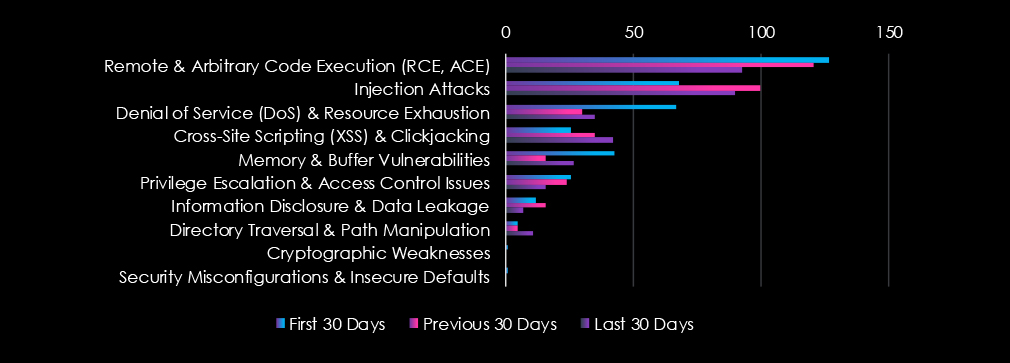
Remote & Arbitrary Code Execution and Injection Attacks are the most common vulnerabilities, followed by DoS, XSS, and Memory & Buffer vulnerabilities.

In total, information technology comprises 21.04% of all detected industry vulnerabilities in the last 90 days, ranking 3rd out of 13 industries.
Below are observed key trends across 90 days.
Remote Code Execution (RCE):
127 → 121 → 93 (↓27% overall)
Still the top vulnerability, but decreasing steadily, likely due to better patching or fewer zero-days.
Web-Based Vulnerabilities on the Rise
Cross-Site Scripting (XSS): 26 → 35 → 42 (↑62% from Jan)
Directory Traversal: 5 → 5 → 11 (↑120%)
Attackers are increasingly targeting web apps and poorly structured file systems.
Injection Attacks Remain High
68 → 100 → 90
Persistent and second only to RCE in volume—classic yet effective.
DoS Vulnerabilities Bounced Back
67 → 30 → 35
After a dip, they’re climbing again—especially critical in high-availability environments.
Memory/Buffer Vulnerabilities: 43 → 16 → 27 (resurfacing after a dip)
Privilege Escalation: Dropping steadily → 26 → 24 → 16
Information Disclosure: Peaked in Feb, now down to 7
Cryptographic & Misconfiguration Issues: Rare but shouldn’t be ignored
In the past 90 days, CYFIRMA has identified 293 verified ransomware victims in the IT industry. This accounts for 13.4% of the overall total of 2,194 ransomware victims during the same period, placing the information technology industry 2nd out of 14 industries.
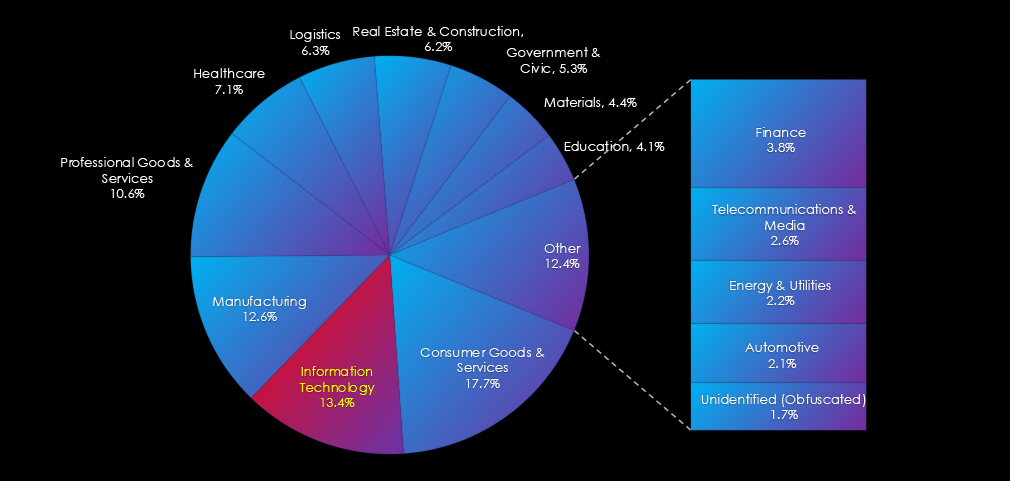
Furthermore, a quarterly comparison reveals a significant increase of interest in the IT industry of 65.5% from 177 to 293 victims. With the overall share increase from 11.1% to 13.37% of all victims.
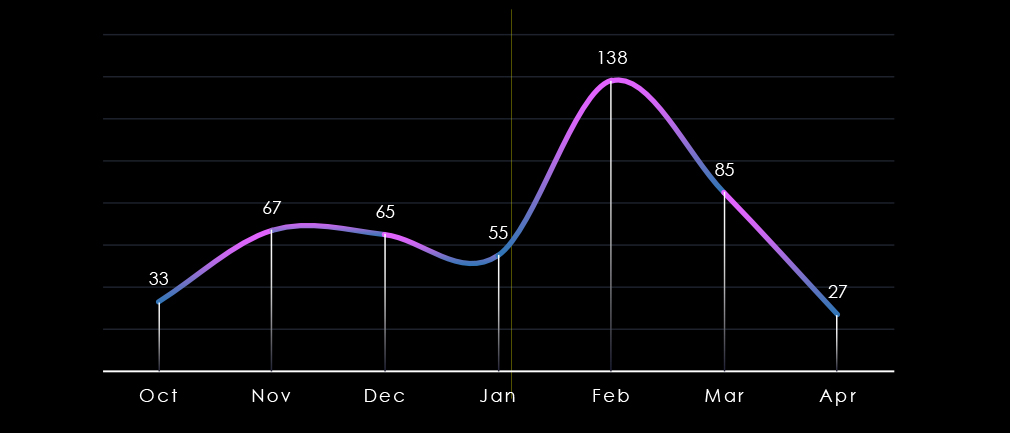
Over the past 180 days, we have observed significant and sustained activity across months with a spike during February doubling the average number.
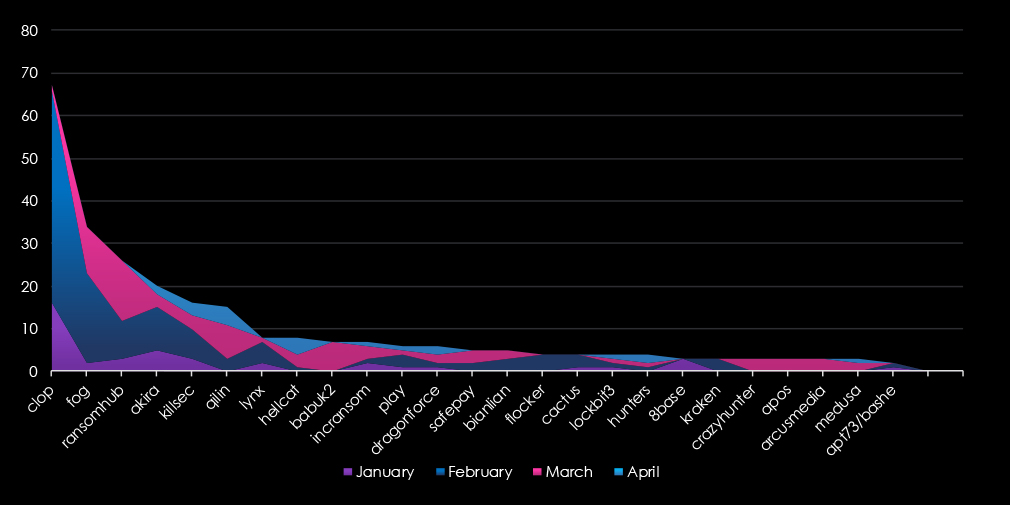
A breakdown of monthly activity per top 25 gangs provides insights into which gangs were active each month. For example, the most active gang Cl0p behind February spike has recorded most victims during their February rampage. On other hand Babuk2 recorded all victims in March.
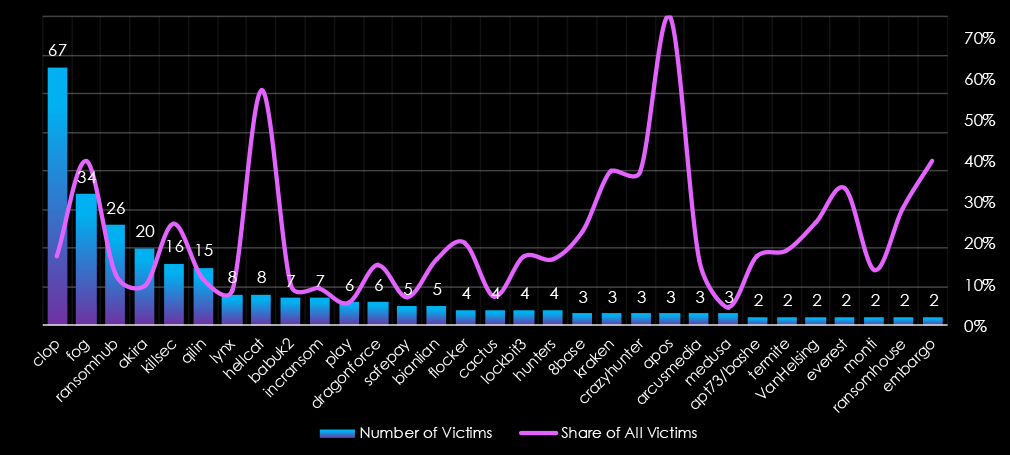
In total 46 out of 69 gangs were active in the last 90 days (only 31 with at least 2 victims shown in the chart). Cl0p gang recorded the most victims (67), followed by Fog (34), and RansomHub (26). The share of all victims for some gangs in this industry is very high. The second most active gang Fog recorded 40% of their victims in this industry.
The other top 5 gangs Cl0p (16.9%), RansomHub (12.2%), and Killsec (24.6%) also recorded significant shares in this industry.
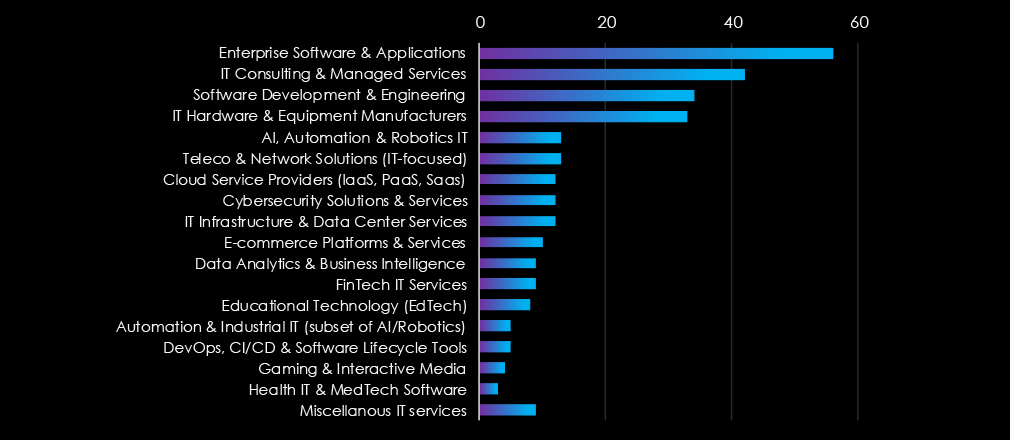
Enterprise Software & Applications and IT Consulting & Managed service were the most frequent victims in the IT industry in the past 90 days.
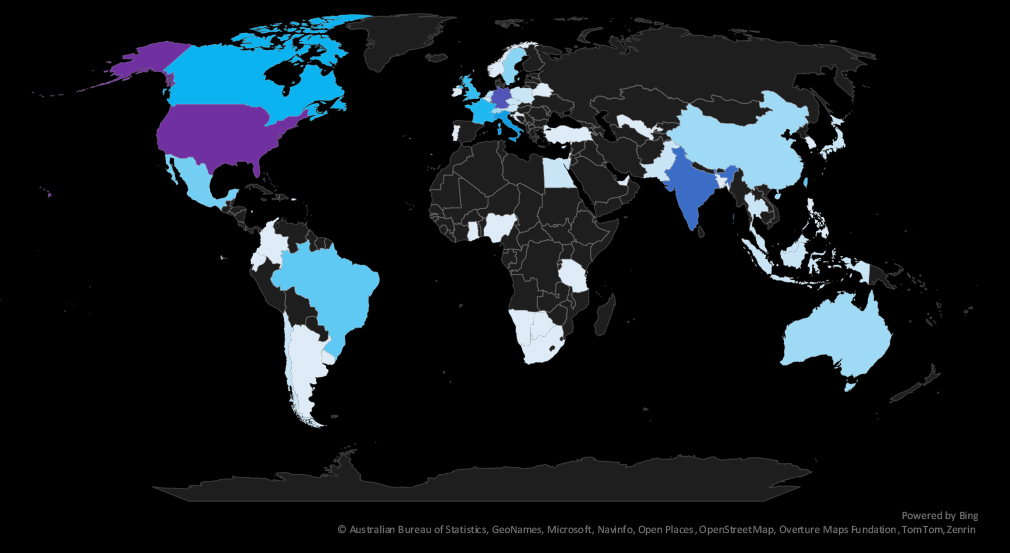
The geographic distribution heatmap underscores the widespread impact of ransomware, highlighting the countries where victims in this industry have been recorded.
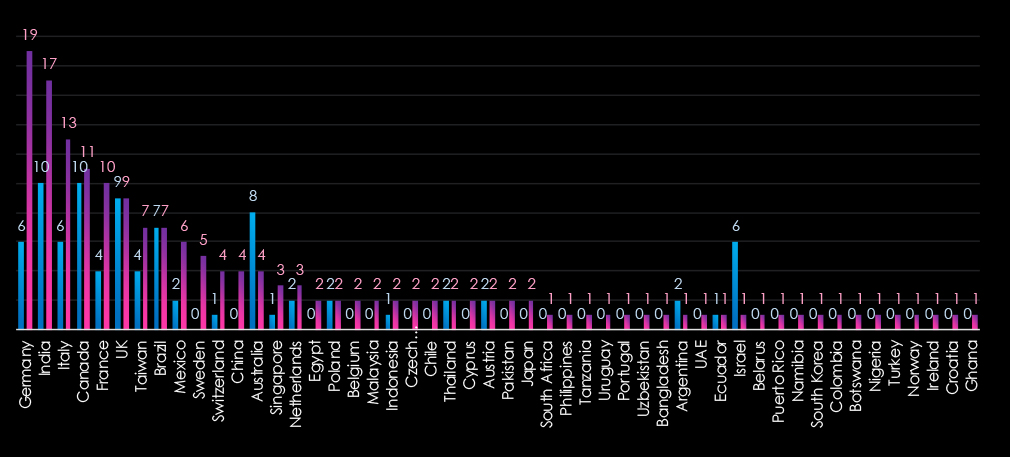
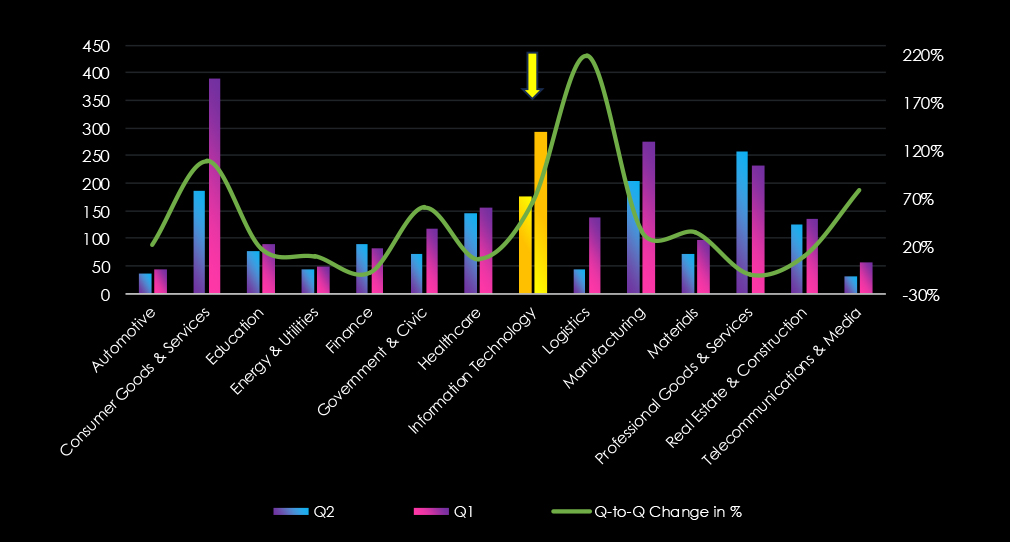
The chart shows quarter-to-quarter changes in targeted countries. Data is sorted by last 90 days and compared to the previous 90 days marked blue.
The USA recorded 119 victims in the last 90 days, an increase from 75 and represents 41% of all victims. Germany, India, Italy, and Canada follow in the top 5 with 19, 17, 13, and 11 victims respectively, observing an increase from the previous 90 days.

The information technology industry placed 2nd out of 14 monitored industries recording 293 victims in the last 90 days, a significant increase of 65.5% from 177 victims in the previous 90 days period.
The overall share increased from 11.1% to 13.37% of all ransomware victims.
Monthly Activity Trends
Monthly activity was significant and sustained across the last 180 days with a major spike in February driven by Cl0p gang which doubled the monthly average.
Cl0p was the most active gang overall, followed by Fog and RansomHub.
Ransomware Gangs
A total of 46 out of 69 active ransomware groups targeted this industry in the past 90 days:
Cl0p: The most active with 67 victims and 16.9% of their victims are from the IT sectors (67 out of 396 victims).
Fog, Hellcat: Highest share in top 10 gangs. 40% and 57% victims in this industry (34 out of 85 and 8 out of 14) respectively. Fog in particular shows a high focus on IT companies.
Geographic Distribution
The geographic distribution of ransomware victims in this industry is truly global across all continents. The USA (119) accounted for 41% of all victims, followed by Germany, India, Italy, and Canada, all of which saw an increase from the previous 90 days.
In total, 51 countries recorded ransomware victims in this industry in the last 90 days, a major increase from 33 in the previous period.
For a comprehensive, up-to-date global ransomware tracking report, please refer to our new monthly “Tracking Ransomware” series here.
APT Campaigns: The IT sector remained a primary target for APT actors, with 80% of observed campaigns (4 out of 5) directed at IT organizations. Campaigns were split between Chinese state-linked groups and unattributed Vietnamese and Thai-speaking actors, with operations recorded in February and March. Japan and Thailand were targeted in all cases. Web applications were exploited in every campaign, with additional targeting of operating systems, routers, network monitoring tools, and database infrastructure, reflecting broad attacker interest in IT stack layers.
Underground & Dark‑web chatter: IT led in all industries in dark web and underground chatter, accounting for 16.67% of total activity. While data leak and breach mentions declined over the period, they remained high overall, indicating persistent exposure. Ransomware chatter spiked mid-quarter (1520 mentions) before dropping sharply. Web exploits and hack/exploit mentions continued steadily, suggesting sustained attacker interest in web-facing IT infrastructure. DDoS and hacktivism activity trended downward but remained visible.
Vulnerabilities: The IT sector represented 21.04% of all reported vulnerabilities, ranking 3rd across industries. Remote Code Execution (RCE) remained the top vulnerability but showed a gradual decline. Web-based flaws increased sharply: cross-site scripting rose 62%, and directory traversal doubled. Injection attacks remained consistently high, while memory/buffer flaws and DoS vulnerabilities resurfaced after dips. Overall, the sector saw broad exposure across multiple vulnerability categories.
Ransomware: IT was the 2nd most targeted industry, with 293 ransomware victims in the last 90 days—up 65.5% from the previous period. This raised the sector’s share from 11.1% to 13.4%. February saw a major spike, largely driven by Cl0p. Of the 69 active groups, 46 hit IT organizations. Cl0p had the most victims, while Fog and Hellcat showed the strongest sectoral focus (40% and 57% of their victims, respectively). The USA accounted for 41% of attacks, followed by Germany, India, Italy, and Canada. Victims spanned 51 countries, up from 33 previously, underscoring the global scale of ransomware targeting IT environments.